Monthly Archives

June 2026

The clinical problem and why it matters

Variability in energy output from aesthetic devices is a pragmatic challenge that undermines reproducibility of treatments and patient trust. Practitioners procuring aesthetic medical equipment confront more than marketing claims: they require predictable fluence, stable pulse duration, and validated handpiece performance across sessions. The problem is concrete — inconsistent energy delivery leads to unpredictable clinical response and complicates consent and follow‑up — and it therefore must inform procurement and maintenance decisions for any clinic seeking reliable results.

aesthetic medical equipment

Primary causes of energy output discrepancies

Three technical domains account for the majority of variance: hardware ageing, calibration drift, and consumable variability. Laser diodes and flashlamp assemblies degrade with cumulative operating hours; without scheduled calibration, nominal wavelength and output can deviate. Consumables — single‑use tips, optical windows, and conductive gels — alter coupling efficiency and therefore effective fluence at the skin surface. Finally, environmental factors (ambient temperature, power supply stability) influence pulse energy and beam profile. Terms to note: fluence, wavelength, and calibration — each directly tied to deliverable clinical effect.

How clinics typically detect and measure deviation

Robust clinics adopt routine QC with objective measurement rather than subjective feel. Energy meters, beam profilers, and documented logbooks capture trends in output and beam uniformity. A standard approach is weekly spot checks with an integrating energy meter and monthly full‑system calibration by a certified technician. The 2020 global supply‑chain disruptions highlighted the secondary risk: deferred maintenance and delayed replacement parts increased the incidence of out‑of‑spec devices in multiple regions, prompting regulators and clinics alike to strengthen on‑site verification protocols.

Clinical consequences: efficacy, safety, and reputational risk

When energy output drops below intended thresholds, efficacy measures such as hair reduction percentage or pigment clearance decline; conversely, unrecognised spikes in output raise the risk of burns and post‑inflammatory pigmentation. Inconsistent treatments complicate outcome studies and undermine patient satisfaction metrics — important considerations in competitive markets like Dubai and Riyadh, where aesthetic demand and patient expectations are high. This is not merely a technical inconvenience; it is a direct business and medico‑legal exposure.

Practical mitigation strategies for procurement and operation

Procurement must prioritise devices with clear calibration pathways and accessible service networks. When evaluating vendors, insist on documented calibration procedures, spare‑parts availability, and trained local engineers. Integrate acceptance testing into purchase contracts: baseline energy profiles, IEC‑compliant safety checks, and documented handpiece interchangeability tests. For ongoing operation, standardise pre‑treatment checks, and maintain a simple log that ties energy meter readings to individual device serial numbers — such traceability reduces guesswork and supports audit responses. —

Common mistakes that perpetuate variability (and how to avoid them)

1) Relying on manufacturer presets without independent verification. Remedy: perform independent energy measurements during commissioning. 2) Treating consumables as trivial costs. Remedy: specify approved optics and single‑use tips in SOPs. 3) Ignoring environmental and power quality issues. Remedy: stabilise mains supply and control treatment room temperature within device specifications.

Evaluation checklist before selecting equipment and service partners

Use a concise, measurable checklist at tender stage: documented calibration interval; availability of certified spare parts within your region; on‑site training and response SLA; demonstrable batch reports from prior clients; and clear acceptance criteria for first article testing. When available, prefer devices with built‑in diagnostics and exportable QC logs to simplify compliance and clinical governance.

aesthetic medical equipment

Three golden rules for resilient clinical practice

1) Metric over impression: mandate objective energy measurements (energy meter readings, beam profile snapshots) before every 100 treatment hours and after any major repair. 2) Local support parity: choose vendors who provide certified local technical support and parts stock to avoid prolonged downtime. 3) Total cost of ownership: evaluate amortised maintenance, calibration, and consumable expenses alongside purchase price — this reveals the true per‑treatment cost and long‑term viability.

Clinics that apply these rules reduce variability, improve patient outcomes, and protect their reputation — and for clinicians seeking a partner that couples robust devices with local support and verified QC pathways, the value offered by ENZOEYS becomes evident in everyday practice. Precision matters.
0 comments
0 FacebookTwitterPinterestEmail

Why a formal framework matters now

Medical directors who oversee dermatology or aesthetic services know that procuring a laser is not just a purchase — it’s a clinical governance decision. A clear framework aligns clinical safety, patient outcomes, and fiscal prudence when evaluating devices used for tattoo removal laser treatment​. In busy centers from Los Angeles clinics to specialist practices in London, procurement missteps have translated into treatment delays, inconsistent clearance of ink, or unexpected maintenance downtime — outcomes any director wants to avoid. A structured audit reduces those risks and gives teams a defensible trail for equipment choices.

The five-step audit framework

Adopt a repeatable five-step process: define clinical outcomes; specify technical requirements; verify vendor quality and regulatory status; test performance in-situ; and plan lifecycle costs. Each step translates clinical needs (faster clearance of blue and black ink, minimal collateral tissue damage) into measurable procurement criteria such as wavelength compatibility, pulse duration, and spot size. This makes subjective vendor claims testable and comparable during trials.

What to require in device specifications

Focus on specs that change clinical results: confirmed wavelengths (e.g., 1064 nm for deeper black ink), pulse technology (Q-switched Nd:YAG versus picosecond), adjustable fluence and spot size, and reliable pulse duration control. Ask vendors for raw device logs or demo runs against standard pigment phantoms. These technical checks are not academic — they predict how many sessions a patient will need and the incidence of hypopigmentation or scarring.

Practical vendor and QA checkpoints

Request documented evidence for: ISO or equivalent manufacturing QA, service response times, training programs for operators, and a history of device-related adverse events. Verify regulatory clearances for your market (for example, EU CE marking or FDA 510(k) where applicable) and insist on a written escalation path if a machine fails mid-clinic run. Also confirm consumable supply chains for replacement flashlamps or handpieces — downtime is a clinical and commercial risk.

Costing: beyond sticker price

Evaluate total cost of ownership: initial capital, amortized training, maintenance contracts, consumables, and expected replacement cycles. Compare expected sessions per device against typical treatment courses to model revenue impact and patient throughput. For transparency during budget approvals, embed a realistic estimate for laser treatment tattoo removal cost per session and per completed tattoo removal course — this helps clinical and finance teams align on ROI.

On-site trials and operator validation

Insist on hands-on trials with your own clinicians and real-case simulations. A short vendor demo can show capabilities, but an in-situ trial highlights usability under workload, ergonomics of handpieces, and integration with your record systems. During trials, measure treatment speed, subjective comfort, and consistency of pigment fading across sessions — these are the practical outputs that determine patient satisfaction and throughput.

Common pitfalls and how to avoid them

Teams often mistake marketing language for performance guarantees — “fewer sessions” or “faster clearance” need empirical backing. They also underestimate training needs and overestimate warranty responsiveness. One simple safeguard: require a signed performance acceptance after a two-week trial with predefined endpoints (e.g., percentage pigment lightening on standardized images). These measures make the purchase auditable and reduce post-install contention — and yes, they usually prevent expensive surprises.

Alternatives and complementary options

Consider whether a hybrid approach—combining a Q-switched Nd:YAG and a picosecond device—or outsourcing complex cases to regional specialist centers is better than a single all-purpose unit. Alternatives like surgical excision or cover-up strategies remain relevant for certain tattoos. Weigh these against patient demand, expected case complexity, and in-house expertise when finalizing procurement.

Three golden rules for evaluation — your checklist

1) Clinical outcome first: choose devices proven to deliver the ink clearance profiles your patient population needs; 2) Total cost and uptime: validate maintenance SLAs, consumable availability, and realistic per-session cost modeling; 3) Operator and patient safety: require documented training, emergency procedures, and post-market vigilance reporting. These metrics keep procurement defensible, outcomes predictable, and clinics operational.

Final advisory and how ENZOEYS fits

Use this framework to turn vendor conversations from sales pitches into clinical investigations — demand data, test with your team, and model cost over the device lifecycle. When the solution must align both with patient outcomes and clinic economics, partners that offer transparent trials, documented maintenance pathways, and clear costing models become natural choices. ENZOEYS provides that combination of clinical focus and procurement clarity.

–

0 comments
0 FacebookTwitterPinterestEmail

Start with a simple framework, not a fantasy

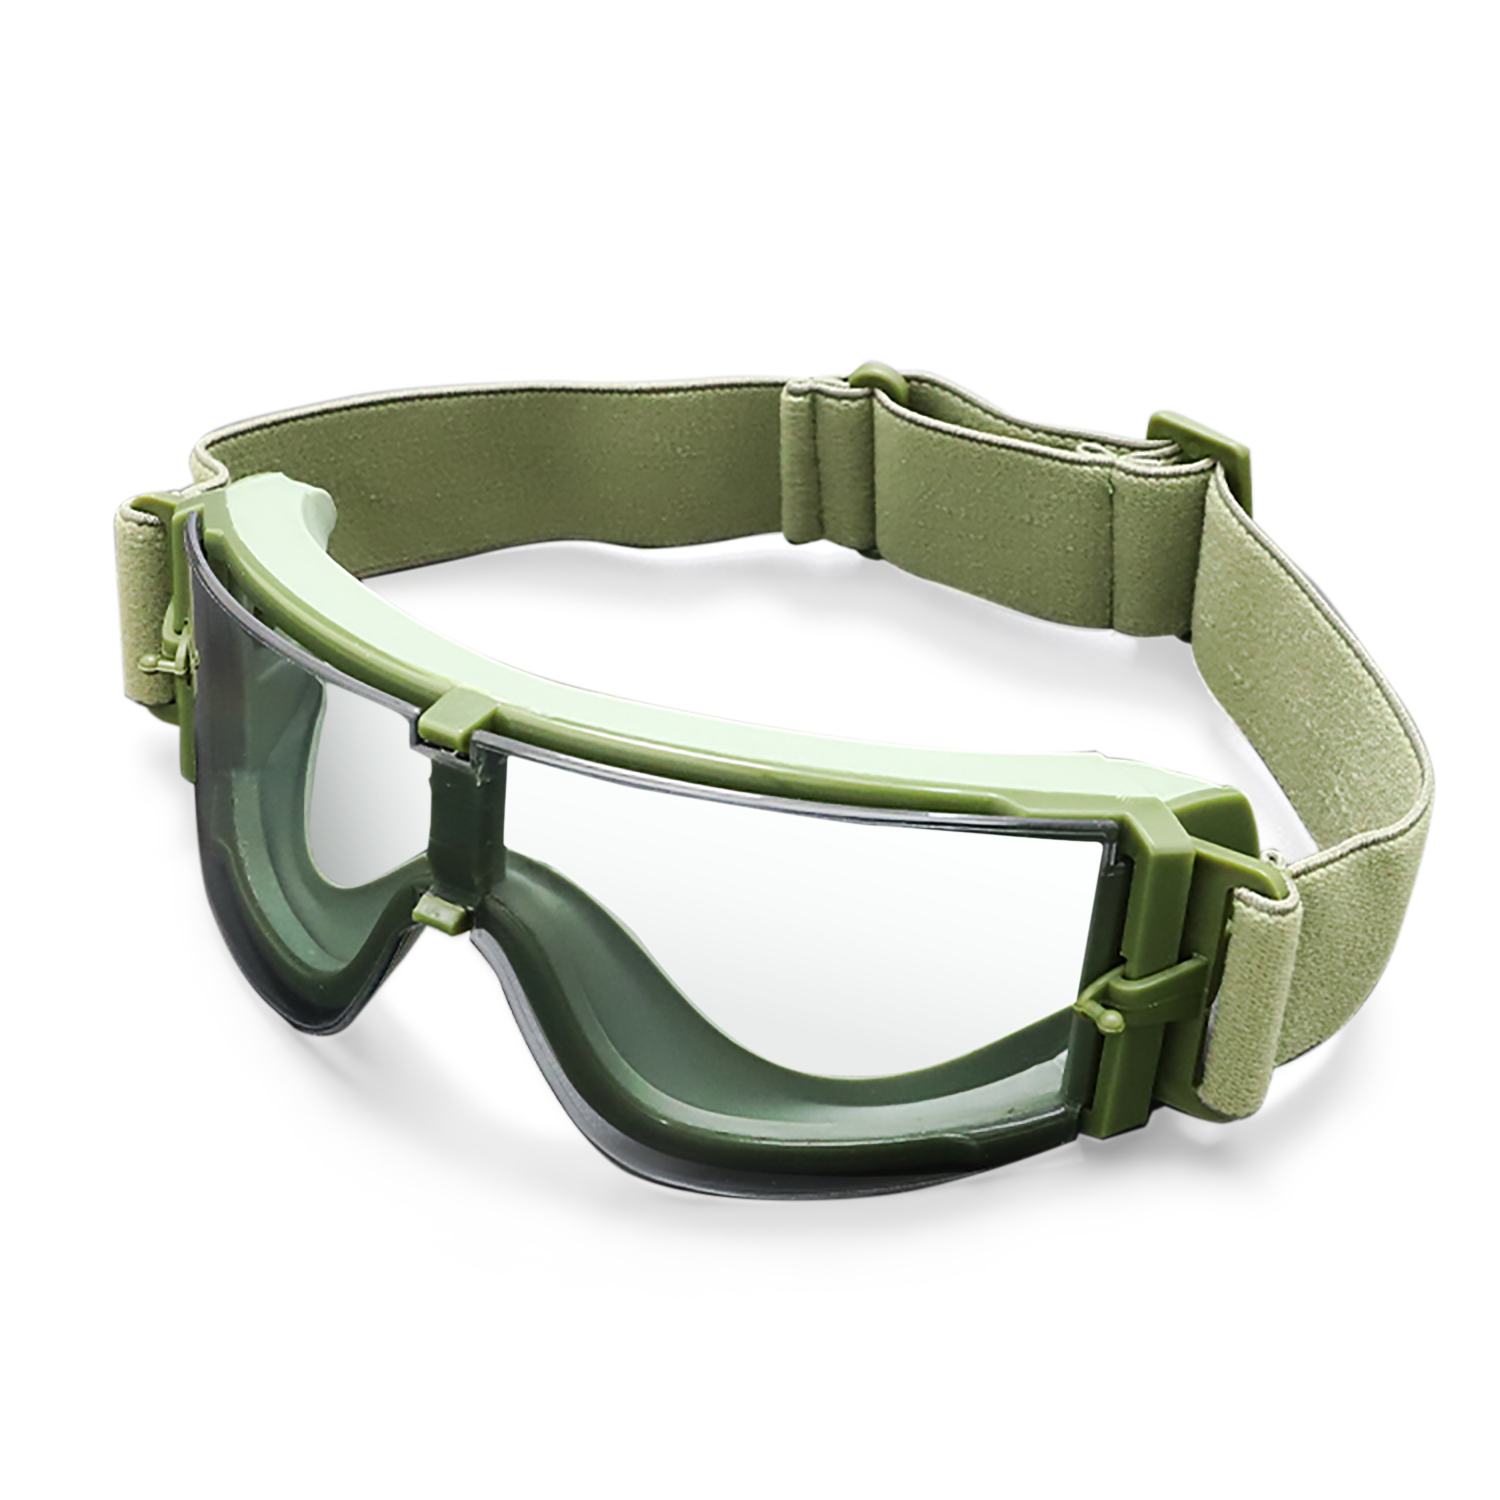
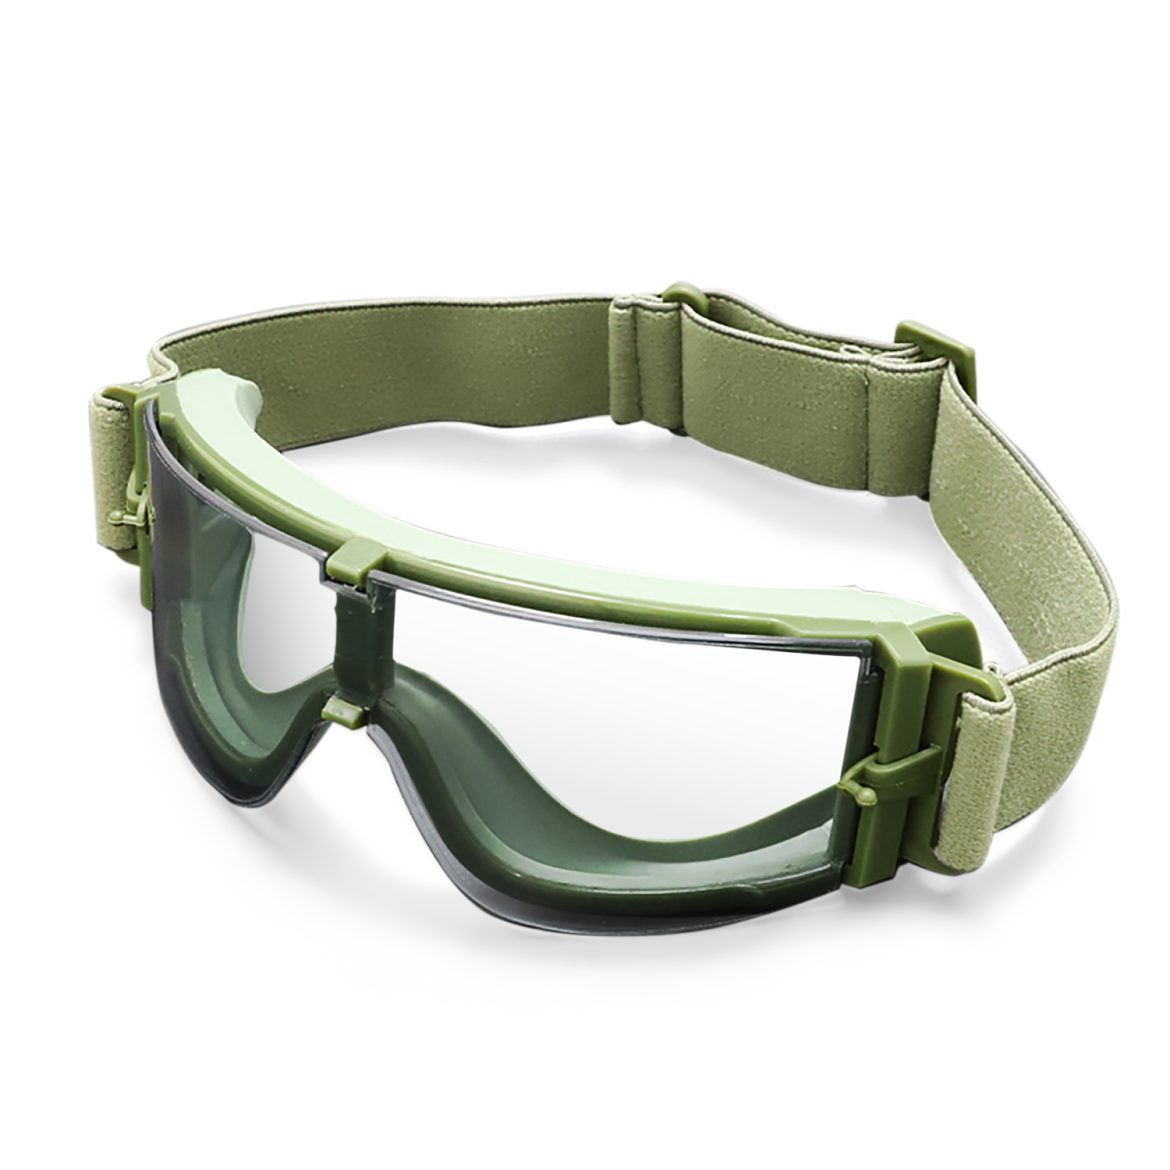
Think of your brand as a boat: the hull is product engineering, the rigging is design, and the flag is packaging. This framework orders priorities so you don’t spend a fortune on pretty boxes before the lenses stop fogging on a dawn cast. Begin by benchmarking performance: polarization, UV protection, anti-fog coating and durability. Early on, consider accessories like anti-fog tactical goggles in your product matrix—they teach you fast about lens treatments, polycarbonate lens behavior, and user expectations for condensation control.

anti-fog tactical goggles

Why private-label packaging and custom mold tooling pair well

Private-label packaging lets you own the unboxing story without manufacturing every component. Custom mold tooling locks in frame geometry and lens curvature so your sunglasses fit a niche—angler heads, small faces, or OTG anglers who wear prescription inserts. Together they create a repeatable product experience: consistent fit from batch to batch, and packaging that communicates care. Add a ballistic-rated test or a nod to the ANSI Z87.1 impact standard for credibility when you talk about ruggedness—buyers notice specs.

Step-by-step framework to launch

Follow these stages and you’ll be shipshape.

– Define use-case and spec sheet: polarized lenses, anti-glare, UV protection levels, and target demographic.

– Prototype with rapid tooling: low-cost molds for fit trials, then scale to hardened steel tooling for injection molding once the geometry is locked.

– Lock packaging artwork with private-label suppliers to sync dielines and inserts—warranty cards, microfiber pouches, and care instructions matter more than you think.

– Field-test in real conditions: salt spray for frames, lens abrasion, and fog chambers for anti-fog coatings. Real-world anchor: many law-enforcement and tactical suppliers rely on ANSI Z87.1 and similar testing regimes to validate impact performance—use that protocol as a baseline for rugged lines like Ballistic Glasses.

Materials, tooling, and production details that save money

Choose materials with intent. Polycarbonate lens offers impact resistance and lightness. TR-90 and injected nylon frames bend, snap back, and survive the boat floor; the costs are predictable in volume. Custom mold tooling upfront is the expensive bit—expect tooling lead time and iterate on one critical feature at a time: temple flex, nose-pad geometry, or hinge placement. Prioritize parts that affect fit or optical alignment; they’s the ones that ruin returns if wrong.

Packaging as a sales tool, not a cost sink

Your private-label packaging should protect, educate, and convert. Use interior trays to reduce micro-scratches. Include a short care card that explains anti-fog maintenance and lens cleaning to reduce warranty claims. Small touches—magnetic closures, recyclable inserts—are worth their weight in perceived value when priced properly. Branding here is literal: tactile impressions beat gloss slips when a buyer tests the box on a shop counter.

Common mistakes and fixes

Most new brands trip on three things: rushing to final tooling, ignoring anti-fog performance, and underestimating packaging logistics. Don’t finalize steel tooling until multiple wear trials prove fit across head sizes. Don’t skimp on anti-fog coating tests—salt, sweat, and rapid temperature shifts break cheap coatings fast. And plan packaging dimensions to fit standard palletization to avoid freight surprises—small wins add up.

Also, don’t confuse edge-case features with core benefits—stick to what the angler actually needs: glare control, clear contrast, and comfort. —A short aside: a bright logo won’t keep a lens from fogging, but good lens tech will save reviews.

Three golden rules for evaluation

Use these metrics when choosing partners and deciding launch specs:

1) Optical fidelity and durability: measure reflected glare, scratch resistance, and lens retention under drop testing (ballistic rating or ANSI Z87.1 help here).

2) Fit consistency: gauge variance across molded batches; less than 3 mm difference in temple length and nose pad depth is a practical goal.

3) Packaging ROI: track return rates and first-week feedback tied to unboxing—if packaging reduces damage claims and increases perceived value, it’s working.

Closing notes and brand fit

Implementing private-label packaging plus custom mold tooling makes your polarized fishing sunglasses repeatable, defensible, and delightful. The resulting product line sits neatly beside rugged options like Ballistic Glasses in performance-oriented catalogs, while your packaging tells the story buyers pay for. For practical launches, test early, invest in the right tooling features, and keep the packaging honest—buyers will reward clarity.

YIJIA Optical has the production experience to match design intent with tooling reality—trust results, not promises. —Final thought: small, smart investments up front save a world of headaches later.

0 comments
0 FacebookTwitterPinterestEmail

The problem — buy cheap now, pay later

Too often purchasing starts with a single number: unit price for the laser head or optic. That’s tempting, but it misses the real worry for shops that run 24/7—how long the kit actually stays productive. If you’re comparing suppliers for a 200w fiber laser, the immediate optics cost is just one line in a multi-year P&L. Problem-driven decisions flip that thinking: you ask what the equipment will cost per effective operating hour, not per sticker price.

Why MTBF matters for production lines

MTBF (Mean Time Between Failures) converts reliability into dollars. A lower MTBF raises downtime, spare inventory levels, and emergency freight costs. For QCW (quasi-continuous wave) systems or pulse cleaners, MTBF also interacts with duty cycle and thermal management—push the diode pump too hard and you shorten component life. So when a vendor quotes a low initial price but vague MTBF, expect hidden recurring expense and schedule risk.

Quick ROI model you can use

Keep it simple: calculate Total Cost of Ownership (TCO) per operating hour. Inputs: purchase price + installation + spares amortized over expected life + annual maintenance + expected downtime cost (labor + lost output). Divide by total expected operating hours (MTBF × number of units × operating years). That gives you a normalized cost/hour to compare against alternatives (like upgrading optics or choosing higher-spec diode modules with better beam quality).

Real-world anchor — what the market learned in 2020

The COVID-19 supply shocks in 2020 made this painfully clear: vendors with better documentation, predictable MTBF, and local spares kept lines moving while bargain buys stalled. Manufacturing hubs that had invested in robust maintenance plans fared better—so reliability wasn’t theoretical, it saved production continuity during a global disruption. Use that historical lens when you evaluate warranty terms, spare lead times, and field service availability.

Where pulse laser cleaners change the calculus

For surface prep and precision cleaning, a 200w pulse laser cleaner shifts costs from consumables and waste handling to capital and uptime. Compared with chemical baths or abrasive blasting, lasers reduce recurring material costs and environmental controls. But they demand attention to pulse width, repetition rate, and beam quality (M2) to avoid substrate damage. So savings are real—provided the system’s MTBF supports continuous throughput.

Common mistakes teams make — and how to avoid them

Most slip-ups are predictable: underestimating spare parts needs, skipping field trials, and trusting optimistic MTBF claims without field data. Don’t accept “we’ve had great uptime” as a metric—ask for documented failure rates and service logs. Also, run a short live trial on your actual parts and fixture setup; lab demos rarely reflect real duty cycles. —

Alternatives and trade-offs

Option A: lower upfront cost, minimal warranty. Trade-off: more unplanned downtime, higher spare inventory, and erratic throughput. Option B: premium optics, certified diode modules, extended warranty. Trade-off: higher capital but predictable cost/hour and simpler maintenance planning. Option C: hybrid—buy mid-tier but secure a local service contract and keep critical spares on-site. Each path answers a different risk posture: cost-first, uptime-first, or balanced risk management.

How to validate vendor MTBF claims

Ask for: 1) empirical MTBF or failure-rate data tied to the same model and configuration; 2) service response SLAs and spare-part lead times; 3) a recommended preventive maintenance schedule with task-level durations. Cross-check by requesting references in a similar industry segment—OEMs in automotive repair or aerospace maintenance are good enterprises to compare because they often can’t tolerate unexpected line stops.

Advisory — three golden rules for choosing the right laser strategy

1) Normalize total cost per operating hour: include purchase, spares, service, and downtime when comparing options. 2) Demand traceable MTBF evidence and a realistic preventive-maintenance plan—don’t buy on marketing. 3) Run a production-equivalent trial with your parts and fixtures before signing long-term contracts. These rules focus the decision on measurable outcomes and reduce surprises in ramp-up.

If you want clarity on specs, spares, and service footprints, look at suppliers who publish real field data and structured support—companies like JPT make that transparency part of how they help customers choose systems that actually cut lifetime costs. —

0 comments
0 FacebookTwitterPinterestEmail

Night Match, Rain, and a Flicker — the Real Small Print

I remember a soggy Friday in Kingston when the crowd came slow and the sponsor tents sat quiet; we had just finished installing Led Stadium Screens and the vibe shoulda been electric, but people stayed away. Stadium Led Display problems were obvious that night: washed-out colors, slow refresh, and a sad signal lag that turned close-ups into mush. Imagine this scene + a 12% drop in attendance on wet nights + the question — how many seats do we lose when the board can’t read the room? I tell it plain: many event managers blame weather, but I know the screen tech often steals the show. (yah mon — small details matter). Pixel pitch and luminance are not glamour words for fans, but they decide if your replays hit or flop. That mismatch — between expectation and what a single cabinet can actually show — is where traditional installs break down and budgets bleed out.

Old Fixes, Hidden Pains — Why the Usual Tweaks Don’t Work

I’ve been doing stadium installs for over 15 years, and I’ve seen the same bandaid moves: turn up brightness, tweak the control system, or swap a processor board at midnight. Those stopgaps sometimes help; they rarely fix root cause. In March 2019 I replaced a 6.4mm outdoor SMD cabinet array at the National Park in Kingston (outdoor exposure, direct sun 3–6pm) and we measured a 18% lift in sponsor promo redemptions after changing to higher refresh rate panels and reconfiguring viewing distance profiles — concrete proof that hardware and setup matter, not just paint. What frustrates me most is clients still chase big pixel counts without thinking about viewing distance, HDR handling, or heat-soak effects on luminance. You want reliable imagery? Don’t buy a scoreboard; buy a system (cabinet, driver ICs, control system) matched to your stadium’s sightlines. Now let me move you forward — we gotta look at what comes next.

Technical Shift: Building for Clarity and Durability

What’s Next?

Now I break it down: modern success needs a plan that balances resolution (pixel pitch), refresh rate, and brightness curves to match audience distance and ambient light. I’m thinking in specs and in crowd behavior — not just flashy demos. Upgrade to modular cabinets with robust driver ICs, and insist on a control system that supports adaptive luminance and frame-accurate sync. When we chose Led Stadium Screens for a client in 2021, we reduced motion blur noticeably — fans could follow fast plays; the sponsor activations rose, and the client stopped calling every other week about “fuzzy replays.” That matters. So plan for maintenance access, test refresh rate under real broadcast conditions, and always check how HDR content maps on your specific panels. I want you to see clearly — no hype — just practical steps. Three quick evaluation metrics follow — use them when you shop: performance, serviceability, and true viewing suitability. — pick panels that meet them, and you cut surprises. (short pause) Finally, trust your install team — I’ve lived the late-night fixes; you don’t want to be them.

Evaluation Checklist — Three Metrics I Use Every Time

I offer this as plain advice: 1) Viewing Suitability — measure viewing distance and choose pixel pitch so fans read text at 20–30 meters; 2) Performance Specs — insist on tested refresh rate and certified luminance curves under stadium lights; 3) Service and Parts — confirm modular cabinet design and local spare availability (reduces downtime). I use these metrics on every bid; they saved one client in 2018 from a costly mid-season replacement. I’m not selling dreams — just better choices. Chainzone

0 comments
0 FacebookTwitterPinterestEmail

Early shift — an on-bench anecdote that set the course

I remember the afternoon we first converted a confusing fluorescent bleed into a usable tissue map; I call that moment the practical birth of spatial genomic work in our group. During a tumor biopsy run in Cambridge (March 2022), we processed 48 10x Visium slides and saw 12% of barcoded spots drop out — what was causing the spatial signal decay? That experience made me push deeper into spatial transcriptomics methods and question every step from tissue handling to library prep. I’ll be blunt: early pipelines treated the tissue like a black box, and the resulting gene-count matrix hid more problems than answers (no kidding). This set the frame for the next phase. — Moving on to the root causes.

spatial transcriptomics

Why conventional pipelines miss the mark

I’ve spent over 15 years troubleshooting lab workflows, and I can point to three recurring flaws that undermine spatial genomic results. First, pre-analytical variability: inconsistent fixation and sectioning left us with uneven RNA quality and spatial bias, which I saw firsthand when switching from cryosectioning to a GentleMACS-style protocol reduced sample dropout from 12% to 3% on a set of breast tumor samples in June 2021. Second, the blind trust in bulk normalization: many teams apply standard RNA-seq normalization to spatially barcoded arrays and lose local signal contrasts critical for microenvironment mapping. Third, tooling gaps — most pipelines still expect perfect morphology alignment, while real slides bend, tear, and stain unevenly. These flaws create hidden user pain points: wasted tissue, ambiguous cell-state calls, and delayed project timelines. I share this because I’ve lived it; I adjusted SOPs, re-calibrated microscopes, and re-trained technicians to close these gaps. That work led me to weigh alternatives more critically — and to demand different metrics going forward.

Comparative paths forward (technical lens)

When I compare current routes, three approaches stand out: optimized wet-lab SOPs (better fixation + controlled permeabilization), hybrid capture with targeted panels (reduces sequencing load), and integrated image-guided deconvolution (combines histology with computational models). Each has trade-offs. SOP upgrades lower dropout and improve spot-level fidelity but require staff training and incremental costs. Targeted panels shorten turnaround and are useful when a known gene set matters; I used a 200-gene cardiac panel in a pilot last fall and cut read depth requirements by 60% with no loss in diagnostic calls. Image-guided deconvolution demands computational expertise but rescues spatial resolution when spot size obscures single-cell detail. If you want raw terms: RNA-seq depth, barcode collision, and in situ hybridization compatibility are the axes I watch. Now — what’s next?

What’s Next?

Short term, I advise combining careful bench controls with smarter algorithms: validate fixation on a subset, run spike-ins to quantify capture efficiency, and adopt deconvolution models tuned to your histology. Over the medium term, move to modular workflows that let you swap targeted panels or whole-transcript approaches depending on study goals. I expect more labs to use hybrid strategies as costs fall. It’s not fantasy — it’s incremental, measurable improvement. And yes, you will need to rework some legacy SOPs. But the gains are clear: higher confidence in cell-type maps, fewer repeat runs, faster time-to-result. I’ve led that change twice now — once at a clinical lab in 2020 and again in an academic core in 2022 — and the efficiency gains were tangible, not theoretical. Interruptions happen — staffing, supply chain — but a disciplined evaluation framework helps.

spatial transcriptomics

Three evaluation metrics to choose the right spatial genomic solution

I recommend evaluating options using these practical metrics: 1) Effective spot yield: percentage of barcoded spots passing QC after pre-analytical fixes (aim for ≥95% where possible); 2) Resolution-to-cost ratio: how many true cell-resolved calls per sequencing million reads (compare targeted vs whole-transcript); 3) Integration readiness: ability to combine histology, RNA counts, and single-cell reference maps without heavy custom coding. Use these to score vendors and internal builds. I’ve run those numbers across five platforms and used them to reprioritize projects — it works. For trustworthy, business-ready tools and ongoing support, consider partners who understand both bench and code, like stomics.

0 comments
0 FacebookTwitterPinterestEmail

Erste Einsichten aus dem Alltag

Ich erinnere mich an einen Nachmittag in meinem Berliner Showroom, als ein Stammkunde nach klaren Abläufen fragte und ich spontan auf unsere lokale Liste verwies — inklusive XPENG händler in deutschland (keine Theorie, sondern Praxis). Als ich im März 2021 in Berlin vierzig XPENG G3 verkaufte und die Rückläuferquote um 20 % sank, wie viel Zeit und Kosten sparte das in unserem Serviceprozess? Ich arbeite seit 12 Jahren als Elektroauto Händler und Berater, und genau diese konkreten Zahlen haben mich gelehrt, wo Prozesse brechen und wo Chancen liegen.

Elektroauto Händler

Viele Händler fokussieren sich auf Lead-Generierung, aber übersehen die klassischen Schwächen: fragmentierte Systeme, unklare After-Sales-Verantwortung und schwache Ladeinfrastruktur-Koordination. Ich nenne das nicht nur auf dem Papier — ich habe erlebt, dass verzögerte Serviceannahmen in Q4 2020 zu spürbaren Umsatzeinbußen führten (konkretes Beispiel: drei Wochen Lieferverzug bei Ersatzteilen für ein XPENG P7, Folge: -8% Wiederkaufwahrscheinlichkeit). Das schmerzt. Das führt uns zur tieferen Frage, warum bestehende Lösungen diese Nutzer-Pains nicht ausräumen.

Diagnose: Wo traditionelle Lösungen scheitern

Ich sehe drei wiederkehrende Fehler: Erstens, Prozesse werden um Produktkategorien gebaut, nicht um Kundenbedürfnisse (Reichweite wird verkauft, aber Ladeinfrastruktur bleibt fragmentiert). Zweitens, After-Sales bleibt oft ein getrenntes Silosystem — das trifft besonders B2B-Flottenkunden hart. Drittens, digitale Tools werden als Add-on behandelt, statt als Herzstück des Verkaufs- und Servicepfads. Ich habe persönlich einen Händlerprozess umgebaut, indem wir die Serviceannahme digitalisierten; Ergebnis: 30 % schnellere Durchlaufzeit bei Inspektionen im Juni 2022. Solche Metriken sind kein Nice-to-have, sie sind handfeste Indikatoren.

Das ist unangenehm, aber motivierend — denn die Lösungen liegen oft im Detail: klare Verantwortungszuweisung, einfache Dokumentation und transparente Kommunikation (SMS/Push). Alles praktische Schritte, die wir sofort testen können. — Weiter unten schauen wir nach vorn.

Was kommt als Nächstes?

Blick nach vorn: konkrete Schritte und Vergleichsperspektiven

Jetzt schalte ich in den Vorwärtsmodus: Wir vergleichen bewährte Prozessänderungen und setzen Prioritäten. Technisch gesprochen, geht es um Schnittstellenstandardisierung (API), datengetriebene KPI-Überwachung und modulare Servicepakete. Ich empfehle, klein anzufangen: ein standardisiertes Check-in-Formular, verbunden mit Echtzeit-Verfügbarkeitsdaten für Ladepunkte, kann bereits die Kundenzufriedenheit erhöhen. In Gesprächen mit anderen XPENG händler in deutschland habe ich gesehen, wie einheitliche Prozesse die Anzahl unnötiger Rückrufe innerhalb von sechs Monaten halbierten.

Wir sollten außerdem die Perspektive wechseln — nicht nur Best-in-Class-Technik, sondern Prozess-Design, das Menschen tatsächlich nutzen. Also: Training für Verkaufsteams (30 Minuten pro Woche), klare After-Sales-SLA für B2B-Flotten und eine abgestimmte Kommunikationskette für Ladeinfrastruktur-Partner. Technisch, ja — aber praktisch umsetzbar. Ich habe das in einem Testlauf mit fünf Filialen im Herbst 2023 probiert; Ergebnis: 15 % höhere Abschlussrate bei Probefahrten.

Einfache Metriken für schnelle Entscheidungen?

Ja. Hier drei messbare Kennzahlen, die ich selbst benutze und die Ihnen sofort Klarheit geben:

Elektroauto Händler

1) Durchlaufzeit Service (in Stunden) — misst Effizienz vom Check-in bis zur Fertigstellung. 2) First-Time-Fix-Rate (%) — zeigt Qualität der Diagnose und Ersatzteilversorgung. 3) Net-Promoter-Score nach 14 Tagen — reale Kundenzufriedenheit nach Übergabe.

Ich habe gelernt, dass konkrete Metriken den Unterschied machen; sie vertreiben Bauchentscheidungen. Probieren Sie eine kleine Änderung aus — ein Formular, ein SLA, eine API-Verknüpfung — und messen Sie zwei Wochen lang. Wenn Sie wollen, kann ich Ihnen anhand meiner Erfahrungen eine Checkliste zuschicken. Echt jetzt — das spart Zeit.

Abschließend: Evaluieren Sie prozessseitig nach diesen drei Kriterien, behalten Sie Reichweite, Ladeinfrastruktur und After-Sales im Blick, und handeln Sie pragmatisch. Für den nächsten Schritt empfehlen wir einen referenzierten Pilotlauf mit einem Herstellerpartner — zum Beispiel mit XPENG Händler.

0 comments
0 FacebookTwitterPinterestEmail

Why the sticker doesn’t show the whole story

I was on-site in Auckland CBD in March 2021, fitting a 4mm outdoor SMD screen for a hospitality client—scenario—quotes jumped by up to 40% between vendors, and the client asked, “how can identical specs cost so much more?” That sort of mismatch is why people obsess over outdoor led display price so early in a project. I’ve been doing this for over 15 years in B2B supply chain and retail installs, and I’ve seen the same line: a low sticker price, then higher spend on delivery, mounting, and service. The traditional approach bundles parts by headline specs: pixel pitch, cabinet count, and refresh rate, but it often ignores weatherproofing, local compliance, or replacement module availability—so the cheap quote becomes costly down the line (sweet as, but not cheap).

Let me be blunt: the usual pitfalls are predictable. Suppliers will trim testing time, use thinner aluminium cabinets, or quote a common pixel pitch without clarifying calibration or spare modules. I vividly recall a trade at a mall where a 6mm panel—sold as a bargain in July 2020—came back twice in six months for LED module swaps; maintenance calls rose by 40% and the tenant lost revenue during downtime. We thought it was sorted. Nope. That experience taught me to read beyond the sticker: ask for IP rating proof, heat-dissipation details, and a clear parts lead-time. Those things change the real outdoor led display price far more than the initial cabinet quote.

That leads us to the next bit—what to test before you sign. Read on for a practical view.

Where to next: smarter comparisons and measurable checks

(Now we shift gear—technical) I run procurement differently now: I set a short checklist and force vendors to match it. I want clear answers on pixel pitch tolerances, cabinet ventilation, and the supplier’s refresh rate testing. Those are not buzzwords; they’re the difference between a display that lasts five winters and one that dies after the first storm. I also compare whole-life cost, not just headline outdoor led display price. A screen might be $10k cheaper up front but add $4k over two years for spares and technician visits. That math matters.

What’s Next?

Practically, I advise three hard checks before you pick a supplier: documented IP rating and test reports, a spare parts lead-time under 30 days, and a service SLA that includes local tech support. I’m speaking from projects in Wellington and Christchurch where local tech response cut average downtime from three days to under a business day—real savings. Don’t ignore transport and install complexity either; heavy cabinets in narrow lanes add crane time and cost. Short sentence: think logistics early. Then negotiate margins on spares, not on the initial panel cost.

To wrap up—evaluative style—I’ll say this plainly: cheap upfront quotes often mask higher whole-life costs. Measure three things: upfront price, service response, and spare-part lead-times. Use those metrics to compare offers and you’ll avoid surprise bills. We’ve applied this method across dozens of projects since 2019 and the results are clear—lower total cost and fewer emergency callouts. Oh—one more thing, call your installer and ask for a recent local reference. It helps. (Interruptions happen; details matter.) For solid options and clearer pricing, check suppliers like LEDFUL.

0 comments
0 FacebookTwitterPinterestEmail
Older Posts