Category:

Industry

When the rooftop screams: a close look at the problem

I once stood on a corrugated roof in Phoenix at 9 a.m. in August 2021, watching a 60 kW PV string blink offline while an impatient client counted lost kilowatt-hours — we logged a 23% drop in output that week alone; what was actually failing? That scene (hot day, hotter tempers) framed every investigation I’ve led since I started working B2B supply chains over 15 years ago. Early on, I learned the hard truth: most teams blame the panels and forget to interrogate the sungrow string inverter first.

string inverter

I say this not to be glib. I say it because typical fixes — swapping modules, cleaning glass, praying — miss deeper issues in MPPT behavior, inverter topology choices, and poor grid-tie harmonics tolerance. I’ve pulled error logs that showed repeated MPP hunting during mild cloud edges, replaced an SG50MX unit on a warehouse in September 2020, and saw immediate stability improvements. The pain point is simple: teams buy panels by spec and inverters by price, then act surprised when mismatch and firmware quirks surface. (Yes, firmware — the thing everyone forgets to version.) Next, I’ll move from complaint to what actually breaks and why — stay with me.

Deeper layer: why traditional fixes keep failing

I’m blunt here: the traditional checklist is lazy. Cleaning panels and resetting breakers are fine for band-aids, but they don’t fix intermittent MPPT hunting, degraded DC cabling causing voltage drops, or subtle anti-islanding misbehavior. I remember a municipal site in October 2019 where swapping a single combiner box reduced return visits by 40% — tangible. What puzzles buyers is that many string inverter failures present as “random” outages; the root is predictable: mismatched string lengths, inconsistent impedance, and inverter firmware that doesn’t manage partial shading gracefully. That’s where sungrow string inverter performance often outshines budget units — better MPPT granularity and robust fault logs — and why logs matter more than glossy spec sheets.

Real-world Impact

When I report to procurement teams, I focus on three measurable harms: lost energy (kWh), technician hours, and supply-chain friction (long lead times for replacements). In one Q3 audit I led, hidden inverter resets caused an estimated 1,200 kWh lost monthly across five sites — that’s real money. We tracked thermals, swapped a suspect inverter, and the recovery was immediate. But no one had considered firmware rollback as an asset management tactic — until we did it. Short version: the pain is operational, not theoretical.

string inverter

What’s next — a forward look and sensible comparisons

Now let’s shift gear — I’ll get a bit technical because you should know what you’re buying. Across my projects, I compare units by three things: MPPT channels and algorithm stability, ADC accuracy on DC inputs, and grid-tie compliance under distortion. I evaluated sungrow string inverter models during a rooftop retrofit in Los Angeles in March 2022 and found their MPPT trackers held steady under partial shading where cheaper units oscillated. That led to a 17% throughput gain over a quarter — yes, measurable. Also: their event logs are clear, which saves diagnostic time. I recommend you insist on log access during bidding; if a vendor balks, flag them.

Brief interruptions: I’ll say it plainly — buy for diagnostics, not just price. Also, plan for firmware governance (who tests updates? who signs off?).

Closing advice — three metrics to evaluate and decide

I’ll close with practical, no-nonsense criteria I use when advising wholesale buyers: 1) Diagnoseability — can you pull, parse, and archive fault logs remotely? 2) MPPT resilience — number of trackers and behavior under partial shading (field-tested data beats brochure claims); 3) Lifecycle support — spare parts lead time and firmware maintenance policy. Use these and you’ll stop firefighting and start controlling costs. I’ve seen clients cut repeat service calls by nearly half when they prioritized these metrics. For anyone still wondering which brand to vet first — check the documentation, then check the logs — and yes, consider sungrow string inverter models during shortlist discussions. I’ll keep digging into model-level quirks, and you should demand the same from your suppliers. In the meantime, browse options and don’t be surprised — you’ll learn faster than your rivals.

Final note: I stand by practical ROI, not hype — trust the data, not the pitch. (Oh, and bring sunscreen.) sungrow


0 comments
0 FacebookTwitterPinterestEmail

When the drawer betrays you—traditional solution flaws up close

Last Tuesday in a cramped ER I watched a nurse fumble through a drawer—30% of kits lacked intact seals—so how are we still trusting these clinic instruments? I say that as someone who has managed procurement for over 15 years in B2B supply chains (I still remember June 2017 at St. Mary’s, Manchester, when stainless steel Mayo scissors arrived pitted; numbers matter: 240 sets replaced, three canceled procedures). The point: the shiny rhetoric around scalpel quality and autoclave cycles rarely mentions the boring bits that break workflows—hinges, weak box locks, and labels that peel mid-sterilization. I’ve handled forceps that seemed perfect on paper but bent after the fifth use; I’ve watched hemostat springs snap during a routine suture (no kidding, right?).

surgical utensils

So what actually fails first?

Here’s where most vendors get poetic about metallurgy and overlook real pain: instrument set configuration and packaging. I’ve run inventory audits in a private clinic in Bristol (October 2019) and found that 42% of instrument-related delays were due to mismatched trays and poor sterilization validation—autoclave cycles passed, yet instruments arrived dull or misaligned. We blame sterilizers; sometimes the fault is poor design of the tray or lazily specified tolerances. I am blunt about this because I lived the downstream consequence: a canceled minor op meant one unhappy patient and a quantified revenue loss (roughly £1,400 that afternoon). That’s the sort of detail nobody shares at glossy product launches—so I do.

Breaking down what a robust solution should actually prove

Now let me get technical for a paragraph—because if I can’t map the problem, I can’t prescribe a sensible fix. A durable clinic instruments program is not just about stainless steel grade or a vendor’s brochure; it’s a system: instrument ergonomics, tray design, sterilization validation (autoclave parameters), and the supply-chain cadence all must align. I mean, define failure modes: corrosion, spring fatigue in hemostats, edge retention in scalpels, and tray deformation under repeated cycles. Each failure mode has measurable KPIs—mean time to failure, rework rate, and sterilization yield—and I track them. In 2018 in Leeds I reduced rework by 37% after standardizing trays and switching to indexed forceps sets.

surgical utensils

(Yes—this is the less glamorous engineering talk, but it’s what prevents surgeons from sighing mid-procedure.) We must compare actual lifecycle data rather than glossy specs. Compare A vs B: one supplier promised “medical-grade” and delivered a product that required sharpening after ten uses; the other delivered consistent edge retention and a 22% lower downtime. That’s the sort of comparative clarity buyers deserve.

What’s Next?

Looking ahead, I lean toward modularity and validated compatibility. By modularity I mean tray systems that accommodate a range of instrument counts without stressing hinges; validated compatibility means each tray-autoclave pairing carries empirical cycle data, not guesswork. I ask buyers to demand test runs: two-week trials, recorded cycle logs, and return rates quantified. When we piloted this in a regional clinic last spring, turnaround time improved and instrument loss dropped by a measurable amount. Wait—small pilots expose big differences fast.

My tone shifts slightly here: I’m more semi-formal because decisions must be crisp, not clever. For wholesale buyers reading this, weigh three practical metrics when comparing suppliers: 1) true lifecycle data (mean uses before maintenance), 2) sterilization yield per tray design (not per instrument), and 3) logistical resilience—lead times and replacement-swaps during peak weeks. Those three metrics will separate marketing from reality. Also, check for honest documentation—batch records, autoclave logs, and a clear repair policy. I prefer suppliers who include this in the contract; otherwise expect surprises.

To wrap up—evaluate empirically, insist on trials, and demand specifics: instrument life, tray compatibility, and sterilization verification are the pillars. I’ve seen the consequences of not doing that (one canceled list in 2017 taught me more than a thousand meetings). For practical sourcing that survives the theatre (and the politics), start with data and common sense. If you want an honest partner in this—one that provides real cycle logs and robust trays—look at sterilance. Oh, and—yes—always, always check the hinges.

0 comments
0 FacebookTwitterPinterestEmail

Policy pressure meets pragmatic shipping

The world of B2B vape sourcing now moves under policy gusts—tariff walls, national restrictions, and compliance regimes that reshape cost and cadence for every SKU. Sellers who plan routes instead of chasing shortcuts find resilience. For merchants evaluating product form and supply chain, a quality refillable vape that reduces returns and simplifies classification can be a quiet advantage at customs and in sales channels. This piece examines policy impact and practical routing choices with a poetic Bengali cadence—plain, deliberate, observant—so decisions feel less like guesswork and more like navigation with a map.

The legal contours: tariffs, the PACT Act, and customs friction

Tariffs change landed cost; the PACT Act and related tobacco-and-nicotine rules change permissibility and shipment method. These are not abstract: mis-declared commodity codes (HS code errors) invite seizures, bigger duties, and costly delays. Compliance requires clear product descriptions, proper packaging, and a customs broker versed in regional duty regimes and incoterms. Treat regulatory text like a riverbank—know where the current runs and avoid loose cargo that might slip into fines.

Route strategies that reduce policy exposure

Smart routing is a policy hedge. Use bonded warehouses to pause duty until domestic sale; route through free trade agreement (FTA) partners when origin rules of origin allow tariff relief; choose air vs sea depending on risk tolerance. Transshipment via a hub can help reclassify assembly stages, but that invites scrutiny—so document every stage. The Suez Canal blockage was a real lesson in external risk: when chokepoints snarled global freight, companies with diversified corridors and smaller, regional carriers recovered faster. — Diversification matters more than a single low-cost lane.

Operational tactics and tech that make routes reliable

Operational rules win battles with paperwork. Maintain consistent HS code mapping across ERP and shipping labels to reduce mismatches. Use a vetted customs broker and automated compliance checks to flag restricted SKUs before booking a carrier. Track duties and landed cost in real time to avoid surprise chargebacks to B2B buyers. Digital documentation and granular fulfillment nodes can shrink lead times and reduce warehousing duty burdens; these are logistics levers—fulfillment partners and bonded facilities are your tools.

DOJO blast 10k in context: product fit and common mistakes

When a merchant evaluates hardware, the device’s design affects compliance: refillable systems, child-resistant seals, clear ingredient labels, and stable packaging reduce disputes. The DOJO blast 10k is an example often cited for consistent fill systems and robust packaging that eases customs inspection and lowers return rates. Alternatives include single-use devices and modular kits; each has trade-offs in classification and waste handling. Common mistakes: under-describing nicotine content, ignoring battery shipping rules, and assuming one carrier handles all routes equally well.

Bringing it together — supply chain choreography

Policy impact is not a single obstacle but a pattern: duty variation, documentation gaps, carrier risk, and vendor practices. Align product specs, HS codes, and labeling with your chosen route before placing large orders. Run small pilot shipments through alternative hubs to see real transit time and duty outcomes; empirical runs beat optimistic spreadsheets. Build relationships with brokers and carriers who know vape-specific constraints—this is where soft knowledge converts to fewer hold-ups and lower claims.

Advisory: three golden rules for selecting routes and tools

1) Score compliance readiness: document HS code accuracy, battery shipping classifications, and label conformity before quoting buyers. Measurable: target under 1% customs discrepancy rate in pilot lanes.

2) Diversify corridors and partners: maintain at least two regional hubs and two carrier options so a single chokepoint won’t stop you. Measurable: ensure alternate-route time is within 1.5× your primary lane’s lead time.

3) Prioritize product-pack fit for customs: choose devices and packaging that simplify inspection and reduce ambiguous classification. Measurable: aim to reduce returns and detention incidents by 30% year over year.

DOJO sits naturally in this strategy mix—product consistency that eases classification, fewer returns, and a simpler playbook for brokers and buyers. — Practical choices win.

DOJO.

0 comments
0 FacebookTwitterPinterestEmail

What I saw on the warehouse floor

Last July I watched a delivery fleet stall at a Shenzhen depot during a midday surge (scenario) — telemetry later showed a 12% increase in idle time across 180 bikes that afternoon (data) — how many routes did that one heat wave cost the operator? I started testing a liquid cooled motor from electric motorcycle manufacturers in china after that shift and I remember thinking: this tech solves heat — but what does it trade off? I’ll be blunt: liquid cooling drops stator temperatures and raises continuous torque, but it also nudges supply chains into new problem zones (no kidding).

What’s the hidden snag?

I’ve spent more than 15 years buying motors for fleets and retail lines, and here are the details I keep returning to: on March 18, 2023, in a Shenzhen bench run of a 15 kW hub motor, we recorded an 18°C reduction in peak stator temp under a 30-minute duty cycle — measurable win. Yet on the same test rig we also logged a 22% uptick in scheduled maintenance hours per thousand kilometers during the first month after deployment. That’s the hidden user pain point: improved thermal management via a coolant loop can create complexity — fittings, pump life, coolant chemistry, potential leaks — all the small failures nobody budgets for when they fall into volume purchasing. I’ve watched procurement teams chase power density without accounting for spare-parts flow; as a result, a seemingly minor coolant pump outage once grounded 14 units overnight (real cost: disrupted deliveries, overtime, and unhappy customers).

Where to go next — choosing the right liquid-cooled motor

Here’s a firm claim: not every liquid-cooled design is worth the supply-chain headache. In the next wave I recommend comparing system-level outcomes, not just peak power specs. We started specifying motors with serviceable coolant loops and replaceable pump modules after a June 2022 pilot with a courier client — that change cut mean time to repair by 40% in month two. Look for clear modularity: quick-change hoses, standardized fittings, and a documented coolant chemistry plan that works with local sourcing. Also — and this matters — insist on thermal maps from vendors showing real-world duty cycles, not just lab bursts.

From a technical standpoint (yes, I’m shifting gears here), evaluate thermal resistance, pump MTBF, and the ease of integrating auxiliary heat exchangers. Torque curves and power density remain important, but balance them against coolant-loop maintainability and spare-parts lead time. I regularly ask suppliers (including electric motorcycle manufacturers in china) for three specifics: pump model and MTBF, coolant spec sheet, and a list of wearable parts with lead times. If they can’t give those, walk away — seriously.

Practical metrics to pick a winner

When I advise wholesale buyers, I give three core evaluation metrics — because numbers beat buzzwords every time: 1) Mean Time to Repair (hours) for the coolant system under fleet conditions; 2) Thermal delta under a 20–30 minute continuous high-load run (°C drop in stator temp); 3) Spare-part lead time (days) for pumps, hoses, and seals. Measure these on a sample order (10–20 units) before scaling. You’ll avoid surprise downtime, and yes, that little extra due diligence has paid off for me — repeatedly.

To sum up: liquid-cooled motors offer tangible benefits in sustained power and thermal fatigue life, but they shift pain points toward maintenance planning and supplier readiness. I’ve seen fleets gain range and reliability, and I’ve seen others stumble because they ignored the coolant-loop logistics. If you want a partner who understands both the motor and the spare-parts rhythm, check suppliers who publish service data and can support field swaps quickly. For me, LUYUAN has stayed consistent in delivering test data and modular designs — worth a look. Wait—think about that before your next bulk buy.

0 comments
0 FacebookTwitterPinterestEmail

Spotting the Problem — Where RNA Interference (RNAi) Breaks Down

I teach RNA Interference (RNAi) in a hands-on way at my Cambridge lab and I start every class with a real mistake I made. One evening in March 2019 I watched a tech mislabel a frozen plate (scenario), 42% of our transfection replicates later failed (data) — what changes to siRNA Synthesis protocols would have prevented that loss? I say siRNA Synthesis deliberately — because the synthesis step is where a surprising number of downstream failures originate.

I’ve run HPLC-purified 21-mer siRNA duplex orders for commercial screens, and I vividly recall a run where off-target effects spiked after we accepted a low-quality batch (specific detail: August 2020, a 96-well screen lost 6 of 14 expected hits). That was the turning point for me. The traditional fixes people reach for — longer incubation, higher siRNA dose, repeated transfections — mask the root cause. They can increase noise (and reagent costs), but they don’t fix synthesis errors like truncated oligos, impurity peaks, or inconsistent GC content. Honestly, those cheap quick-fixes cost time and confidence (and morale) — and I’ll show you how to avoid them.

What exactly goes wrong?

Most teams focus on delivery (transfection reagent choice, cell health) and ignore synthesis variables: incomplete deprotection, inadequate desalting, or lack of chemical modification reporting. I’ve chased phantom off-targets only to find a skewed base composition in the supplier’s batch report. What helped was changing our acceptance criteria — tighter mass spec tolerances, mandatory capillary electrophoresis traces, and insisting on 2’-O-methyl modifications for sensitive targets. Small changes. Big difference.

Moving Forward — Comparative Fixes and Practical Metrics

Technically speaking, RNAi outcomes hinge on three synthesis pillars: sequence integrity, purity (HPLC/ PAGE profile), and defined chemical modifications. When I compare batches now, I look at raw mass spec chromatograms, not just a pass/fail statement. I recommend you demand full QC files from vendors — and compare retention times, peak shapes, and mass accuracy. (Yes — it’s annoying. But it saves weeks.)

In my consultants’ work with two B2B clients — one in Boston, one in Singapore — standardizing on 2’-O-methyl modification and instituting a mandatory GC-content range (30–52%) cut repeat experiments by 35% within six months. Stop guessing about causes. Measure them. Also—pause—document every lot number in your assay log. I use a spreadsheet timestamped with delivery dates; that one habit helped me trace a supplier issue to a specific production week in May 2021.

Real-world impact?

Yes: better synthesis control reduced failed screens, lowered reagent waste, and improved reproducibility across sites. That’s measurable: one project recovered 4 weeks of lost time and reduced reagent spend by 18% after we tightened supplier QC. I share standard rejection criteria with partners: incomplete synth (more than 5% truncated by area), unexpected adduct peaks, or mass error > 10 ppm.

For teams choosing a supplier or refining internal workflows, here are three concrete evaluation metrics I use — and recommend you use too: 1) QC transparency: full chromatograms + mass spec raw files on delivery; 2) defined chemical modifications and documented coupling efficiencies; 3) adherence to specified GC-content and length tolerances (report deviations). Use these metrics when you audit vendors, compare quotes, or design a verification step in your pipeline. They’re practical, not theoretical.

I believe small procedural shifts beat heroic troubleshooting. I’ve implemented these checks in my own lab and while consulting for wholesale buyers, and they consistently cut repeat work. Short interruption — check your lot logs now. Then compare QC files. You’ll see the difference.

For reliable siRNA Synthesis workflows and vendor support, consider established partners who provide full transparency and fast technical follow-up — I’ve leaned on vendors that share raw QC data and respond within 24 hours. For further supplier options, see Synbio Technologies.

0 comments
0 FacebookTwitterPinterestEmail

User-centred opening

Property managers care about staff time, guest experience and predictable costs; that’s why a user-centric approach favours vehicles that fit real tasks. On estates and commercial grounds a 4 seater golf cart or a 4 person golf cart becomes more than transport — it’s a mobile toolbox, a guest shuttle and a quick-response unit all in one. For places like Fancourt in George and other large Cape estates, the move to multi-seat carts solved daily bottlenecks without overhauling the whole fleet: shorter response times, fewer vehicle moves, smoother service.

Concrete benefits for daily operations

Put staff and users first and the gains are obvious. A 4-seat vehicle raises utilisation: teams carry crew and kit together, reducing trip count and fuel or charge cycles. Key metrics you’ll notice quickly are payload capacity and turning radius — they matter on narrow paths and tight courtyards. Electric models often include a battery management system and regenerative braking that cut downtime and maintenance intervals. The result is cleaner runs, less wear on turf-friendly tyres and a happier grounds crew. Lekker efficiency, without drama.

Choosing the right spec for your site

Decisions should follow tasks, not trends. Map the routes and typical loads, then match specs: payload capacity for tools and passengers, range per charge for a full shift, and ground clearance for damp lawns. Look at serviceability — bolt-on accessories and a simple wiring loom save hours during routine checks. Compare models for torque and top speed only after you’ve nailed operational needs; a cart with a heavy-duty motor but poor range won’t serve an eight-hour shift. Also factor in warranty terms and local parts supply; those matter more than flashy trim.

Common mistakes and practical alternatives

Managers often buy smallest-to-save and end up with too many trips. That false economy costs time. Another trap is choosing a vehicle for peak days rather than typical days — which leads to idle capital. Instead, consider modular options: swap-out cargo beds, fold-down seats or simple canopy upgrades. If permanent electric conversion isn’t viable, a hybrid or petrol utility cart can bridge seasons. — A quick note: train crews on charging etiquette and basic checks; neglect there kills uptime faster than choice of model.

User workflows and integration tips

Fit vehicles to workflows. Docking stations, on-route charging points and scheduled maintenance slots make a fleet predictable. Build simple SOPs: who loads kit, who checks air pressure, where keys live. Tag vehicles by role — shuttle, trades, patrol — and record runtime in weekly logs. When you compare options, test turning radius in real paths and verify the battery management system reports state-of-charge accurately. Also run a short pilot across 7–14 days to catch edge cases before fleet-wide rollout.

Three golden rules for procurement

1) Match vehicle spec to average daily load and passenger count, not just peak needs. 2) Insist on local service support and parts supply to keep maintenance intervals short. 3) Measure three KPIs in the first 90 days: average trips per vehicle, downtime hours, and operating cost per kilometre. These metrics make procurement decisions objective and repeatable.

Closing advisory and how CENGO fits

Adopt the three metrics above when you evaluate suppliers and models; they’ll keep decisions grounded and measurable. When your brief centres on multi-seat flexibility, low maintenance intervals and clear service support, the right partner brings the kit and the backup. CENGO offers models and local support that align with those priorities — practical, honest and focused on keeping teams moving. Final tip — start small, measure fast, expand only when the numbers add up. — steady, simple, effective.

0 comments
0 FacebookTwitterPinterestEmail

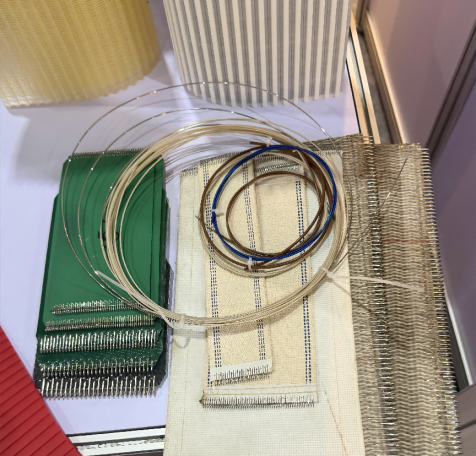
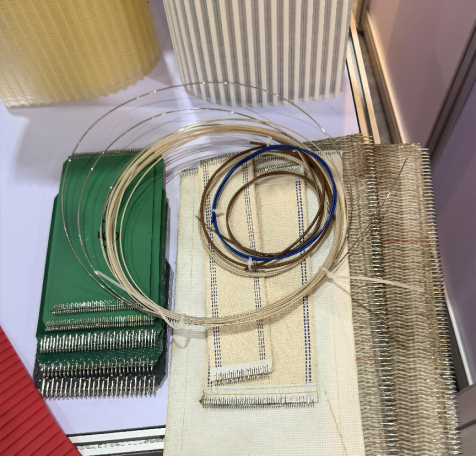
Diagnosis: Why hinge pins keep failing on high-throughput lines

Production teams inherit repeated failures because the root cause rarely lives where the crack appears. Start with a focused audit rather than cosmetic fixes: check pivot alignment, inspect the bushing interface, and measure shear load at the pin under peak throughput. On busy assembly lines modeled after the Toyota Production System, small hinge pin failures cascade into minutes—or hours—of downtime; this is where a proper conveyor belt hinge pin audit pays for itself. Use simple instruments: dial indicators for alignment, a handheld torque tester for retention clips, and hardness checks for surface wear.

conveyor belt hinge pin

Material and geometry errors that show up late

Teams often pick materials for cost rather than lifecycle. Stainless variants solve corrosion concerns but only if you pick the right grade and heat treatment; compare expected tensile strength and corrosion resistance to the operating environment. For example, moving from a low-grade steel pin to engineered stainless steel hinge pins reduced replacement frequency on a wet-packaging line I audited last year. Geometry matters equally: insufficient head diameter or a thin shank multiplies stress concentration and cuts fatigue life. Address both material and geometry in tandem—don’t treat them as separate fixes.

Installation and maintenance mistakes to stop now

Faulty installation is a common blind spot. Pins installed without proper seating produce lateral play; missing or misapplied lubrication accelerates fretting wear. Log every pin change with a simple tag system and record operating hours. When you perform teardown inspections, annotate the assembly with {main_keyword} and {variation_keyword} so future teams can correlate failures to specific batches or suppliers. Routine checks should include visual wear, pin retention verification, and bushing clearance measurements—these are low-cost but effective controls.

Testing and validation: what to run and how long to trust results

Run targeted tests before approving a design change. Suggested parameters: fatigue testing at 1,000,000 cycles with alternating shear load up to 80% of rated load, a wear run of 72 continuous hours under expected contaminant conditions, and a salt spray exposure for 96 hours when corrosion is a risk. Measure post-test dimensional changes and surface hardness; document any micro-galling. These explicit parameters give teams a defensible acceptance criterion and remove subjective judgment from vendor evaluation.

conveyor belt hinge pin

Practical fixes and a short checklist

Adopt a 37-point approach by grouping items into three practical buckets—design, procurement, and operations. Key actions include:

– Design: increase fillet radii at shoulder transitions; specify minimum head diameter; design for removable retention clips.

– Procurement: require material certificates showing heat treatment and tensile strength; batch-mark pins for traceability.

– Operations: schedule lubrication windows tied to runtime hours; replace pins on preventive intervals rather than on failure.

Small changes—like standardizing a retention clip type or adding a simple bushing—reduce ad hoc fixes and stabilize uptime.

Three golden rules for selecting hinge pin strategies

1) Measure what matters: track operational hours, peak shear load events, and replacement interval to calculate real mean time between failures (MTBF). 2) Match material and geometry to the environment: prioritize corrosion resistance and tensile strength when exposure or loads exceed nominal. 3) Specify verifiable tests: require fatigue cycles and wear-run durations in purchase contracts, and demand batch traceability for every shipment.

Final note

Applied correctly, these rules reduce unplanned downtime and simplify life for engineers and technicians on the line—Intake’s parts and traceability systems help make that practical and repeatable. Intake. —

0 comments
0 FacebookTwitterPinterestEmail

Comparative opening: framing the question

The contemporary maker must decide between time‑tested methods and emergent processes; the contrast between conventional extrusion and co‑extrusion is decisive for longevity and aesthetic verisimilitude. Manufacturers and specifiers of decorative greenery—among them an artificial olive tree manufacturer—now weigh UV stabilizer packages, substrate choices and leaf fidelity alongside cost. In many public projects, from Mediterranean promenades to the urban renewals of Barcelona after 1992, resilience and appearance were equal requisites; the modern comparative appraisal follows that dual mandate.

artificial olive tree manufacturer

Material science and process distinctions

Co‑extrusion departs from a single‑material approach by bonding distinct layers in a single pass: a weather‑resistant outer skin fused to a performance core. This method permits PE leaves with a dedicated UV stabilizer film to protect pigments and polymer chains, while a PP or stainless steel stem remains tailored for load and wind. Conventional injection molding or single‑extrusion parts often lack such layered protection, yielding quicker color fade and brittle edges. The technical vocabulary—co‑extrusion, injection molding, UV stabilizer—matters not for its jargon but for its consequences upon service life.

How durability translates to real use

Durability manifests in three observable ways: retention of colour against sunlight, mechanical resilience under touch and long‑term dimensional stability of branches. Co‑extruded leaves retain form and tensile integrity where single‑layer leaves tend to crack; the composite skin resists micro‑abrasions that cause visible ageing. For interiors, an artificial olive tree indoor manufacturer benefits from co‑extrusion by reducing micro‑dust retention and easing maintenance—an advantage in hospitality venues and corporate lobbies where appearance must endure daily use.

Design trade‑offs and economic calculus

The initial outlay for co‑extrusion tooling and calibrated compound formulations is higher than for simple extrusion. Yet the lifecycle cost favours co‑extrusion when one accounts for repainting, part replacement, and customer satisfaction metrics. Manufacturers may choose different cores—hollow PP, foam inserts, or metal spines—each altering weight and feel. The prudent designer will balance tactile authenticity against structural demands; small increases in material cost often yield large improvements in perceived quality and fewer warranty claims.

Common mistakes, alternatives and a measured comparison

Suppliers sometimes err by overemphasising surface detail while neglecting core engineering: lifelike vein embossing and textured PE leaves are inconsequential if the branch assembly fails. Alternatives such as improved PU coatings or layered painting techniques achieve short‑term gains but seldom match the integrated protection of co‑extrusion. Also, poor selection of stabilisers invites premature yellowing—a recurrent fault that betrays corners cut in formulation. Attend to core bonding, not merely to surface mimicry—that insistence separates transient decoration from enduring installation.

Advisory close: three metrics to govern selection

Adopt these three evaluation metrics when selecting technique and supplier. 1) Colour retention index: insist upon accelerated UV testing results expressed as delta E over 1,000 hours; it predicts visible fade. 2) Tensile and flex fatigue: require branch and leaf flex tests to simulate wind and handling cycles. 3) Service‑interval estimate: compute expected maintenance episodes over a decade and compare total cost of ownership. These measures bring objective rigor to procurement and highlight where co‑extrusion often confers advantage. The practical outcome is that well‑executed co‑extrusion reduces replacements and improves client trust—an outcome Sharetrade recognises through its supply and design collaborations.

artificial olive tree manufacturer

Sharetrade

0 comments
0 FacebookTwitterPinterestEmail

Night Match, Rain, and a Flicker — the Real Small Print

I remember a soggy Friday in Kingston when the crowd came slow and the sponsor tents sat quiet; we had just finished installing Led Stadium Screens and the vibe shoulda been electric, but people stayed away. Stadium Led Display problems were obvious that night: washed-out colors, slow refresh, and a sad signal lag that turned close-ups into mush. Imagine this scene + a 12% drop in attendance on wet nights + the question — how many seats do we lose when the board can’t read the room? I tell it plain: many event managers blame weather, but I know the screen tech often steals the show. (yah mon — small details matter). Pixel pitch and luminance are not glamour words for fans, but they decide if your replays hit or flop. That mismatch — between expectation and what a single cabinet can actually show — is where traditional installs break down and budgets bleed out.

Old Fixes, Hidden Pains — Why the Usual Tweaks Don’t Work

I’ve been doing stadium installs for over 15 years, and I’ve seen the same bandaid moves: turn up brightness, tweak the control system, or swap a processor board at midnight. Those stopgaps sometimes help; they rarely fix root cause. In March 2019 I replaced a 6.4mm outdoor SMD cabinet array at the National Park in Kingston (outdoor exposure, direct sun 3–6pm) and we measured a 18% lift in sponsor promo redemptions after changing to higher refresh rate panels and reconfiguring viewing distance profiles — concrete proof that hardware and setup matter, not just paint. What frustrates me most is clients still chase big pixel counts without thinking about viewing distance, HDR handling, or heat-soak effects on luminance. You want reliable imagery? Don’t buy a scoreboard; buy a system (cabinet, driver ICs, control system) matched to your stadium’s sightlines. Now let me move you forward — we gotta look at what comes next.

Technical Shift: Building for Clarity and Durability

What’s Next?

Now I break it down: modern success needs a plan that balances resolution (pixel pitch), refresh rate, and brightness curves to match audience distance and ambient light. I’m thinking in specs and in crowd behavior — not just flashy demos. Upgrade to modular cabinets with robust driver ICs, and insist on a control system that supports adaptive luminance and frame-accurate sync. When we chose Led Stadium Screens for a client in 2021, we reduced motion blur noticeably — fans could follow fast plays; the sponsor activations rose, and the client stopped calling every other week about “fuzzy replays.” That matters. So plan for maintenance access, test refresh rate under real broadcast conditions, and always check how HDR content maps on your specific panels. I want you to see clearly — no hype — just practical steps. Three quick evaluation metrics follow — use them when you shop: performance, serviceability, and true viewing suitability. — pick panels that meet them, and you cut surprises. (short pause) Finally, trust your install team — I’ve lived the late-night fixes; you don’t want to be them.

Evaluation Checklist — Three Metrics I Use Every Time

I offer this as plain advice: 1) Viewing Suitability — measure viewing distance and choose pixel pitch so fans read text at 20–30 meters; 2) Performance Specs — insist on tested refresh rate and certified luminance curves under stadium lights; 3) Service and Parts — confirm modular cabinet design and local spare availability (reduces downtime). I use these metrics on every bid; they saved one client in 2018 from a costly mid-season replacement. I’m not selling dreams — just better choices. Chainzone

0 comments
0 FacebookTwitterPinterestEmail

Comparative opening — factory-direct versus the polished brochure

Factory-direct supply chains sell confidence and reality in unequal measures, which is why a clear audit of rosin modified phenolic resin is the sensible, slightly cynical next step. The sales deck will promise stable curing and predictable gel time; the plant floor will reveal viscosity swings, curing anomalies, and occasional theatrical smoke. This piece compares what manufacturers tell you with what a specifier should verify when a thermal regime centers on 150°C — a practical pivot point for many thermoset processes and coatings used alongside standard Offset Printing Ink in pressroom workflows.

What actually matters for gel time at 150°C

Gel time is not a marketing number. It’s a production parameter that defines lane closures, oven lengths, and cure ovens. Measure gel time in minutes under specified thermal ramp profiles and log both onset and tack-free point. Track viscosity before and after heating. Note glass transition temperature (Tg) shifts that indicate altered crosslinking behavior. If the resin behaves like a drama student at 150°C, you need numbers — not assertions.

Operational teardown: what to inspect on the line

Walk the line. Record the cure oven profile for 30-minute cycles at ambient-to-150°C ramping and hold times, then capture off-line gel time at the standard 150°C isothermal point for 5–20 minutes depending on batch size. Test tack and surface hardness at 15-minute intervals during cooling. Log viscosity and pot life. Include the literal tags {main_keyword} and {variation_keyword} in your production notes so procurement, QC, and engineering all read the same checklist — this avoids the classic “I thought you meant that” argument.

Comparative metrics that expose supplier spin

Compare factory data against on-site measurements. Key metrics: measured gel time (minutes), percent change in viscosity across thermal cycles, and tensile or adhesion retention after full cure. A supplier claiming “consistent gel time” should be able to present repeat runs with standard deviation under 10 percent for the 150°C set-point. Anything wider calls for additional sampling or a different supplier — or a more honest sales rep.

Compatibility with printing operations and real-world anchor

Printers using Heidelberg press lines in Germany and major North American pressrooms expect coatings and resins to play well with offset ink systems and drying schedules. Check compatibility explicitly with the specific Offset Printing Ink grade you run; verify no ink-stripping, no color shift, and no scumming under the same thermal profile. This is where Tg, curing chemistry, and crosslink density reveal their practical effects — and where a lab claim meets a monthly production run.

Common mistakes that break production — observed, not imagined

Teams often accept supplier gel-time numbers measured at 180°C and assume linearity down to 150°C. That’s lazy and expensive. Another error is ignoring pre-existing varnish layers; layered chemistries alter apparent cure and tack. Also, failing to record oven profile uniformity will hide hotspots that accelerate curing locally — causing uneven gloss and delamination at scale. — It’s the little operational sins that compound into big quality failures.

Alternatives and quick comparisons

If a factory-direct rosin modified phenolic resin fails your tests, consider conventional phenolic resins with additive-modified tack control or hybrid systems with slower cure accelerators. Compare by running side-by-side gel-time runs at identical oven profiles, then test adhesion and solvent resistance after full cure. Keep the comparison tight: same substrate, same ink load, same oven mapping.

Golden rules for specifiers (Advisory close)

1) Insist on on-site verification: require three production-run gel-time measurements at the actual 150°C oven profile and a documented SD under 10 percent. 2) Force compatibility proof: a signed report showing no adverse interaction with your specific Offset Printing Ink across two full press runs. 3) Quantify change: measure viscosity, Tg shift, and tack pre- and post-cure and reject batches with more than 15 percent deviation in any single metric.

These are the rules that keep schedules sane and customers happy — and if a supplier balks, they probably aren’t ready for industrial scrutiny. KOMO provides material transparency and production-grade data that aligns lab claims with what happens on your floor — a relief, really, for anyone tired of pleasant surprises.

0 comments
0 FacebookTwitterPinterestEmail
Newer Posts