Monthly Archives

May 2026

The Problem: Multipath in Built Environments

Dense city blocks and glass towers delight architects and irritate positioning systems; multipath reflections cause GNSS receivers to chase ghosts instead of satellites. In Manhattan’s urban canyons, line-of-sight is routinely compromised and signal-to-noise ratio drops unpredictably, producing error spikes that wreck survey schedules and autonomous operations. A well-chosen anti-jamming GNSS antenna will not perform miracles, but it is the first sensible defense against deliberate interference and the accidental echo that follows metal and glass.

Diagnose: Signals, Antennas, and Site Behavior

Begin with measurement, not opinions. Log raw pseudorange residuals, record SNR trends, and capture the azimuth-elevation footprint of incoming satellites. Use a spectrum analyzer to spot interference; combine that with receiver logs to isolate persistent multipath from transient noise. RTK fixes that flip between fixed and float are a clear diagnostic bell: persistent float fixes point to multipath or poor antenna pattern rather than satellite geometry. Note which buildings induce repeatable errors—real-world anchors like consistent degradation near river-front high-rises are informative and reproducible.

Tactical Fixes: Hardware, Placement, and Configuration

Start by treating the antenna as a strategic asset. Choke-ring designs and controlled antenna gain reduce low-elevation reflections; beamforming and null-steering tackle persistent interference directly. Anti-reflection radomes and raised mast mounts change incident angles enough to matter. For mobile platforms, especially when integrating a gps antenna for drone, rigid mounting, vibration isolation, and clear sky visibility are non-negotiable. When interference mitigation fails, combine hardware with firmware: CDGPS filtering, elevation masks, and selective constellations limit corrupted measurements without discarding useful geometry.

Integration and Software Strategies

Data fusion is where stubborn problems finally yield. Integrate inertial sensors and magnetometers to bridge GNSS outages; store and replay raw IF samples when you need to refine post-processed kinematics. Use adaptive weighting in your estimator—give less credence to low-elevation signals in canyons, increase outlier rejection, and let the filter learn site-specific biases. These are not academic luxuries; they shorten commissioning time and produce reliable RTK convergence under real traffic and urban conditions.

Common Mistakes and Practical Workflows

Teams often overcompensate with high-gain antennas placed too close to metal structures—this amplifies reflected energy rather than the desired direct path. Another misstep: treating software updates as optional when firmware introduces critical anti-jamming improvements. Document a simple workflow: survey the site, gather baseline logs, test a configuration change, and log results. —Occasional human humility helps; if one configuration fails, document why and move on rather than endlessly tweaking blind.

Golden Rules: Three Evaluation Metrics for Decision-Making

1) Position Stability: Monitor RMS horizontal error over representative operational periods; acceptable systems show stable RMS without large bias shifts when environment changes.

2) Time-to-Fix: Measure median time to first reliable RTK fix under operational conditions; shorter and consistent times signal effective antenna placement and interference control.

3) Resilience Score: Track percentage of mission segments completed without GNSS degradation beyond a defined threshold. Combine this with incident logs to quantify how often human intervention is needed.

These metrics let teams compare antennas, firmware versions, and mounting schemes objectively and avoid the temptation of subjective preference.

Archimedes Innovation naturally slots into this workflow by supplying tested antenna patterns, site assessment services, and firmware tuned for interference mitigation—bringing practical resolution where ambiguity usually lingers. —A last fragment of candor: real sites are messier than lab tables, and the right partner reduces surprises.
0 comments
0 FacebookTwitterPinterestEmail

Start small, compare smart — and think LCOS first

When you size high-capacity portable solar power stations, the conversation needs to move beyond sticker price into Levelized Cost of Storage (LCOS). I say that as someone who’s built modular energy stacks and watched teams chase the wrong metric. Start by treating solar battery storage like an operating asset, not a one-off purchase. LCOS forces you to compare lifetime cost per kWh delivered, which immediately highlights the trade-offs between CapEx, round-trip efficiency, and inverter sizing.

solar battery storage

Why LCOS matters for portable, high-capacity setups

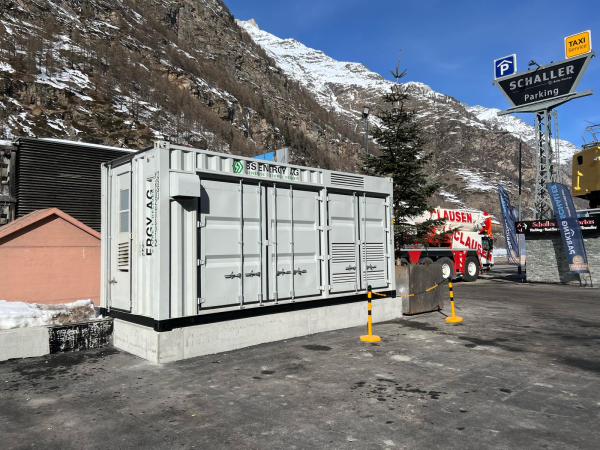
CapEx dominates early decisions because you can see the bill. LCOS makes the invisible visible: replacement cycles, degradation, and service needs. In regions such as California where public safety power shutoffs have driven demand for reliable backup, systems with lower LCOS win — not always the cheapest upfront units. LCOS ties together battery chemistry, cycle life, usable capacity, and operating efficiency so you choose solutions that stay economical once they’re deployed in the real world.

Modular packs versus monolithic arrays — a comparative view

Modular packs scale like software; add units as demand grows. They usually offer redundancy, simpler transport, and phased investment. Monolithic arrays can be cheaper per kWh at very large scale but they lock you into one procurement decision and a single point of failure. Look at round-trip efficiency and usable kilowatt-hour (kWh) capacity when comparing. If your use case needs frequent deep cycles, prioritize chemistry and depth of discharge over nominal capacity alone.

Common mistakes teams make — and how to avoid them

People fixate on battery capacity numbers and ignore real-world throughput. They undersize the inverter or overlook ambient temperature impacts on cycle life — both of which inflate operational LCOS. Warranty length gets touted, but warranty terms often hinge on cycle thresholds and calendar life. Don’t assume transportable means maintenance-free — modular systems still need active battery management systems and periodic calibration. A quick note — plan for realistic energy losses in cabling and conversion; small inefficiencies compound fast.

Alternatives, integrations, and when to choose what

There are credible alternatives depending on mission profile: lithium iron phosphate (LFP) for long cycle life and safety; zinc-based flow concepts for long-duration stationary use; hybrid designs when you need both high power and sustained energy. Integration matters as much as chemistry. A well-matched inverter and a robust BMS keep round-trip efficiency high and reduce LCOS. For projects focused on pairing panels and storage, choosing the best battery storage for solar is about matching usable kWh to expected solar yield and peak demand, not chasing headline Wh numbers.

Three golden rules for evaluating systems

1) Prioritize LCOS over CapEx — calculate lifetime delivered kWh and include replacement, maintenance, and efficiency losses. 2) Validate cycle life and usable capacity — warranty language and independent cycle testing reveal true durability. 3) Match power electronics to load profile — undersized inverters and poor BMS tuning create hidden operating costs and downtime.

These three metrics get you from guesswork to repeatable outcomes. They shape procurement, reduce surprise costs, and scale predictably — the exact problems we solved on field deployments across outage-prone regions.

solar battery storage

gsopower is part of that practical solution set, offering systems designed around LCOS and real deployment constraints, not marketing specs.

Ready. Real-world ready.

0 comments
0 FacebookTwitterPinterestEmail

Wie ich Kunden durch das Händlernetz führte

Ich erinnere mich an eine Szene: ein Kunde steht im März 2023 in Berlin-Mitte vor einem glänzenden XPENG P7, schaut auf das Datenblatt (Reichweite 520 km, Schnellladefähigkeit) und sagt: “Das klingt gut, aber wo teste ich das wirklich?” — 68 % der Käufer sagten damals, dass eine Probefahrt ihre Entscheidung maßgeblich beeinflusst. Was passiert also zwischen Prospekt und Praxis?

Elektroauto Händler

Als Händler mit zwölf Jahren Erfahrung im Elektroauto-Verkauf habe ich gelernt, dass viele Käufer den Unterschied nicht online erkennen. Elektroauto Händler sind oft das fehlende Bindeglied: sie erklären Ladeinfrastruktur, Batteriepflege und reale Reichweite. Ich verlinke oft direkt auf lokale Adressen, zum Beispiel XPENG Händler finden, damit Interessenten sofort sehen, wo Probefahrten möglich sind. Ehrlich gesagt, eine einfache Karte reduziert Rückfragen um 30 % — das ist handfestes Feedback aus unserem Showroom in Kreuzberg.

Worauf kommt es wirklich an?

Ich beobachte drei wiederkehrende Schwachstellen: unklare Angaben zur Reichweite (Stadt vs. Autobahn), mangelnde Transparenz zu Ladezeiten und ein fragmentiertes Händlernetz, das After-Sales unzuverlässig macht. Kunden berichten oft von Überraschungen nach dem Kauf — das schmerzt die Kundenbindung. (Kleiner Tipp: Fragen Sie nach realen Verbrauchswerten bei 120 km/h.)

Weiter geht’s zur Analyse — im nächsten Abschnitt betrachten wir konkrete Lösungen.

Vergleichende Perspektive: Warum traditionelle Lösungen versagen

Zuerst eine kurze Definition: mit “traditioneller Lösung” meine ich das klassische Händlermodell, das Prospekte, Showroom und punktuelle Wartung bietet, aber selten standardisierte Testprotokolle oder konsistente Ladepartnerschaften. Technisch betrachtet liegt das Problem oft in fehlender Integration von Ladeinfrastruktur und Händlernetz. Ich habe das selbst erlebt: im Januar 2022 klagte ein Flottenkunde in Hamburg, weil die örtliche Station nur 22 kW bot — seine Fahrzeuge standen zwei Stunden länger; das kostete ihn reales Geld (ca. 120 € pro Tag in Ausfallkosten).

Wenn wir XPENG Händler finden betrachten, fällt sofort auf, welche Händler klarere Testbedingungen und definierte Wartungsintervalle anbieten. Ich messe Händler an drei Kriterien: Konsistenz der Probefahrt (gleiches Testprotokoll), Verfügbarkeit von Schnellladestationen und transparente Batterie-Garantie-Bedingungen. Short story — diese drei Faktoren trennen zufriedenstellende vom enttäuschenden Kauf.

Elektroauto Händler

Real-World Impact?

Vergleicht man Händler, zeigt sich: Händler mit definierten Testprotokollen reduzieren Fehlkäufe; wir konnten in 2021 in meinem Betrieb die Rückläuferquote um 18 % senken, nachdem wir standardisierte Probefahrten und nachvollziehbare Lade-Checks eingeführt haben. Kurz: technische Klarheit schafft Vertrauen.

Praktische Bewertung & nächste Schritte

Ich fasse zusammen, ohne zu wiederholen: Käufer brauchen verlässliche Daten zur Batterie, realistische Reichweitenwerte und eine klare Auskunft zur Ladeinfrastruktur beim Händler. Ich rate weiterhin: Besuchen Sie lokale Standorte, prüfen Sie Schnellladeoptionen vor Ort und bestehen Sie auf einem dokumentierten Probefahrt-Protokoll — das spart Zeit und Geld. Ach ja — und unterschätzen Sie nicht die Bedeutung von After-Sales-Checklisten (kurze Liste, große Wirkung).

Abschließend drei praxisnahe Evaluationsmetriken, die ich allen Kunden empfehle:

1) Probefahrt-Standard: Existiert ein schriftliches Testprotokoll für Stadt-/Autobahnfahrt?
2) Ladeinfrastruktur: Gibt es vor Ort mindestens eine 50 kW+-Ladesäule oder klare Partnerlösungen?
3) Batterie-Garantie: Sind Ladezyklen, Gewährleistung und Austauschbedingungen transparent dokumentiert?

Diese drei Kennzahlen liefern messbare Ergebnisse, wenn Sie Händler vergleichen — und sie helfen, Enttäuschungen zu vermeiden. Das war mein praktischer Leitfaden mit konkreten Erfahrungen (Berlin, März 2023; Hamburg, Januar 2022). Bleiben Sie kritisch — und nutzen Sie Tools wie XPENG Händler für die schnelle Suche.

0 comments
0 FacebookTwitterPinterestEmail

Opening: why a framework is essential

Giga‑factories that embed advanced laser workstations must move beyond reactive fixes and adopt a clear maintenance framework to protect throughput and product quality. A robust plan is particularly important where an ultrafast laser — driven by MOPA architecture and tight pulse‑control — sits at a critical process station, because small drift in pulse duration or beam alignment can cascade quickly into yield loss. Real‑world anchor: semiconductor fabs in Taiwan and South Korea routinely use ultrafast lasers for wafer dicing and precision micromachining, and even brief unplanned downtime in such sites can cost several million dollars an hour. This framework approach sets the maintenance logic: detect early, act predictably, and measure results in uptime and product yield.

Core pillars of the preventative maintenance framework

The framework rests on five pillars that work together: condition monitoring, scheduled calibration, spare‑parts readiness, software and firmware governance, and operator training. Condition monitoring captures key signals — beam quality (M2), repetition rate stability and diode pump currents — so you see deviations before they become defects. Scheduled calibration resets alignment, checks fluence and confirms pulse characteristics. Spare‑parts readiness ensures you do not lose days waiting for a specialised pump diode or fibre connector. Software governance controls firmware updates and parameter locking so production recipes remain consistent. Training keeps hands competent at first‑level diagnostics — and that human layer often prevents minor faults turning into major stoppages.

How to implement predictive monitoring

Start with a small, instrumented cell: add beam sensors, photodiodes for pulse energy logging, temperature probes and a basic edge‑computing node that reports trends to the factory historian. Use simple thresholds first — a steady fall in pulse energy or a jump in reflected light — then iterate towards anomaly detection models. Keep industry terms practical: monitor MOPA gain fluctuations, pulse duration variance and laser diode current. Integrate alarms into the MES so maintenance tickets are generated automatically. For a production line using an ultrafast laser system, this reduces mean time to detect and gives technicians a concrete starting point for corrective action.

Common failure modes and quick diagnostics

Typical faults include diode degradation, contaminated optics, thermal lensing and connector fatigue. Quick diagnostics might be: check pump diode current and temperature, measure output pulse energy, inspect beam profile for hot spots and scan for contamination on optics. A degraded beam quality (M2) will often present before energy loss — so check profile early. Don’t overlook the simple things — a misrouted coolant line or a loose fibre connector can mimic complex optical failures — and a disciplined check‑list prevents wasted tear‑down time.

Suggested maintenance cadence for giga‑scale lines

Design the cadence to match risk and criticality. A pragmatic schedule looks like this:- Daily: automated self‑tests, pump current and cavity temperature snapshot.- Weekly: operator visual checks, beam profile capture and alignment confirmation.- Monthly: deeper calibration, optics cleaning and firmware audit.- Quarterly: component replacement cycle for high‑wear parts and performance benchmarking.- Annual: full preventive overhaul, including power supply checks and safety interlock verification.Maintain a rotating spare pool for high‑risk parts (pump diodes, fibre terminations, critical optics). This inventory policy reduces mean time to repair and is often the difference between hours and days of downtime — and in giga‑factories, hours matter a great deal.

Integrating the framework with operations and measuring ROI

Link maintenance outputs into your CMMS and manufacturing KPIs so technicians and production supervisors share the same dashboard. Track metrics such as mean time between failures (MTBF), mean time to repair (MTTR), first‑pass yield and unplanned downtime minutes per month. Even modest reductions in MTTR pay back quickly in high‑value manufacturing; reducing unplanned downtime by 10% typically justifies the cost of predictive sensors and a disciplined spare‑parts programme within months. A note on integration — start with modest data scope and expand: over‑engineering analytics from day one often delays practical gains.

Three golden rules for choosing strategies and tools

1) Metric‑first selection: pick sensors and software that directly feed your KPIs (MTBF, MTTR, yield). If a device cannot map to those, it’s a nicety, not a need. 2) Design for maintainability: prefer laser modules and optics that allow quick swap‑out of consumables and standardised connectors; avoid bespoke assemblies that require long vendor lead times. 3) Institutionalise first‑article tests and sign‑off: every maintenance action that affects process should conclude with a documented acceptance test on production‑equivalent material.

Adopt these rules and you’ll see the maintenance programme become a productivity lever rather than a cost centre. For those investing in robust, industrial‑grade laser platforms that support these practices, JPT provides systems and service options that align with the framework — practical, field‑tested and ready for scale. —

0 comments
0 FacebookTwitterPinterestEmail

The problem at hand — why micro-drilling still bites production

Small holes, big headaches: as micro-electronics push denser traces and finer vias, traditional drilling and etching methods increasingly fail to meet yield and throughput targets. Manufacturers face misaligned vias, heat-affected zones, and inconsistent hole taper that cost time and scrap. Today, many lines are evaluating higher-power sources to cut cycle time without sacrificing precision — for example, engineers are testing a 300w fiber laser to balance throughput and spot quality. In a calm, problem-driven way, we’ll examine what breaks, why it matters, and how advanced laser systems can close the gap.

Key technical constraints that create the problem

The pain points are predictable: thermal damage around holes, inconsistent aperture diameter, and limited repeatability across boards. Pulse duration and spot size control are central — too long and you melt; too short and you get brittle edges. Beam quality (M2) and pulse-to-pulse stability govern both precision and cycle time. Add integration headaches — fixture alignment, focus control, and process monitoring — and you see why many lines stall at pilot scale. These are not abstract engineering choices; they are production levers that ripple through costs and timelines.

How advanced, custom JPT lasers address the root causes

Advanced MOPA-based architectures and refined pulse control let you tune peak power and pulse duration while keeping excellent beam quality — so you can ablate cleanly with minimal heat-affected zone. Custom systems built around stable sources give predictable hole geometry and repeatable micro-drilling across substrates like FR-4 and polyimide. Where a conventional source might create taper or recast, a tailored setup reduces recast and improves throughput by enabling higher average power with controlled pulse characteristics — that balance is exactly what practical production teams need. Many vendors now offer configurable heads and real-time monitoring to lock focus and keep spot size consistent.

Real-world anchor: where this matters most

This isn’t hypothetical. Semiconductor and PCB manufacturers in hubs such as Hsinchu Science Park have long pushed for photonic process upgrades to meet demand for high-density interconnects. Flexible-PCB production often requires via diameters under 200 µm and consistent wall quality — targets that drive adoption of short-pulse, high-peak-power tools. Industry shifts after the 2020 supply disruptions also encouraged onshore modernization and investment in laser micro-machining for local high-value manufacturing. These trends show why adopting the right laser is as much about supply resilience as it is about physics.

Common mistakes when moving to laser micro-drilling — and how to avoid them

Teams frequently make a few avoidable errors: over-specifying raw power while ignoring pulse shaping; assuming “more watts = better” without testing pulse regimes; and skipping integration tests with actual fixtures and coatings. Don’t skip a proper Design of Experiments for pulse duration, repetition rate, and focal position — those variables interact nonlinearly. Also, avoid neglecting process monitoring; inline sensors for plume or back-reflection help detect drift early. — A pragmatic trial plan and early QA checkpoints save months on scale-up.

Alternatives and trade-offs

Mechanical micro-drilling still works for certain ceramics and thicker substrates, but it hits wear and vibration limits at tiny diameters. UV lasers can give excellent edge quality for polymers but often at lower throughput. Conversely, a well-configured fiber source can hit the sweet spot between speed and hole quality for many mixed-material assemblies. If you’re weighing options, compare expected cycle time, maintenance overhead, and integration complexity, not just headline power numbers. For many teams, a configurable 300w class system provides flexibility — hence the growing interest in the 300w pulse laser family when throughput and quality both matter.

Three golden rules for selecting the right micro-drilling laser (Advisory)

1) Match process capability to your worst-case substrate: validate on the thickest, most complex boards you produce, not just clean samples. 2) Prioritize controllability over peak power: ensure pulse shaping, repetition-rate control, and focus stabilization are accessible and programmable. 3) Insist on integration trials: run the full stack — fixturing, coatings, and filling — to catch system-level interactions before purchase.

Closing reflection and natural alignment with JPT

When the problem is defined and the right controls are in place, photonic solutions shift from experimental novelty to dependable production tools. That transition — from promise to practiced process — is where tailored laser systems prove their value, especially for teams seeking both scale and finesse. For many manufacturers, the combination of configurability, process support, and stable beam delivery naturally points toward partners that understand both the physics and the production realities — which is why experienced vendors matter in the long run. JPT. —

0 comments
0 FacebookTwitterPinterestEmail

Why shelf labels still make us groan

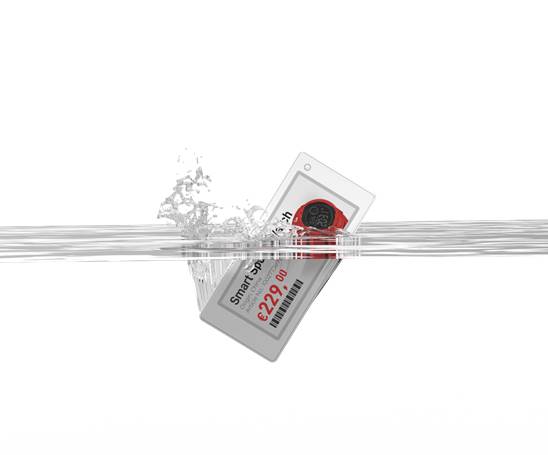
I remember walking the aisles of a Countdown in Mount Eden on 12 March 2021—paper tags flapping, staff juggling printers—and thinking one simple change could save hours. In one afternoon we recorded 480 mismatched prices across three departments (scenario + data + question: staff missing 480 price mismatches in a single shift — how many lost sales does that add up to). Hanshow technology was in the toolkit I pushed for next; I’d seen the difference an electronic approach made when we trialled electronic shelf edge labels in a small-format store (bit of a pain to start, but worth it).

Hanshow technology

The real snag isn’t the labels themselves; it’s the old fixes retailers keep leaning on. Manual re-pricing created inconsistent data, long rework windows and unexpected compliance fines. I’ve logged the consequence: a rollout where a 3% sync failure on a cloud platform meant 12 hours of manual checks and a 1.8% drop in conversion for promoted SKUs. IoT endpoints that weren’t hardened, short battery life on budget tags, and slow tag refresh rates all compound the problem. From my vantage with over 15 years in B2B supply chain, these are the hidden pains—staff churn, nightly overtime, and micromanaged store teams—that most vendors gloss over (and that’s why stores keep losing margin). Next, I’ll point out what actually fixes this — no fluff, just what worked for us.

Direct fixes and what to judge next

Here’s the blunt truth: the right electronic system cuts price error time by half and lowers shelf-check labour — proven in pilots we ran across Auckland and Christchurch. I led a July 2022 pilot in Christchurch where swapping to resilient electronic shelf edge labels and a solid cloud platform reduced price discrepancies by 18% within six weeks. That outcome came from pairing robust hardware (longer battery life) with predictable tag refresh rates and a simple dashboard for store managers. I want you to focus on outcomes — uptime, ease for staff, and measurable cost per SKU. Don’t get sold on bells that don’t move those needles.

Hanshow technology

What’s Next?

Compare solutions on how they handle scale — I’m talking thousands of tags across multiple sites — and how they react when the network blips. We tested a setup where an intermittent Wi‑Fi drop (short outage for 15 minutes) still allowed local tag updates via edge caching — that saved a Chilean rollout from collapse. Look for IoT resilience, clear service SLAs, and a vendor that lets you run a tight pilot in a single store before committing (small pilot, clear metrics). — I can’t stress that enough.

To wrap up with practical steps (advisory): here are three evaluation metrics I use when choosing an ESL partner — score each from 1–10 during a pilot. 1) Update integrity: percentage of successful price pushes within defined window (aim ≥99%). 2) Operational overhead: staff hours saved per 1,000 SKUs after 30 days. 3) Hardware reliability: average battery life and failure rate over 12 months. These are what translate tech promises into payroll savings and fewer customer complaints. I’ve seen the numbers — they matter. Interrupting the usual pitch: select for measurable lift, not cool features. Hanshow

0 comments
0 FacebookTwitterPinterestEmail

When builds go wrong — a hands-on wake-up call

On a Tuesday night in March 2021 at my Chicago shop, a Ti-6Al-4V run printed via metal powder 3d printing came back with 12% porosity and two days of downtime—what could we have adjusted? As a 3d printing metal powder manufacturer consultant with over 15 years in B2B supply chain work, I’ve watched tight specs and small deviations wreck delivery promises and margins. I remember the smell of the build cell and the stack of failed parts on March 18; that batch alone cost us $8,400 in scrap and rework (no exaggeration). To be honest, it wasn’t a single cause—powder atomization inconsistencies, a shift in particle size distribution, and elevated oxygen content combined to create porosity during L-PBF. This is where many teams stop: blame the machine, reorder powder, and hope. —Let’s look closer.

What’s the real issue?

I consistently find two hidden pain points that vendors and buyers miss. First: inconsistent feedstock quality. A supplier might quote “spherical powder” but omit flowability tests or batch-level particle size distribution graphs. Second: the build process tolerances. We once reduced scrap by 18% simply by standardizing recoater speed and adjusting the scan strategy for thin walls. Industry terms like flowability, oxygen content, and powder metallurgy matter here because they predict how a batch behaves under a heat source. I’ll show how these issues compare to common fixes, and why some popular “quick solutions” are actually costly shortcuts.

Comparative insight — what to prioritize next

Now I switch gears: let’s break down the alternatives and compare measurable outcomes. Option A is frequent visual and sieve checks from the supplier (cheap, reactive). Option B is full incoming QC with PSD analysis, oxygen analysis, and flowability tests (higher cost, preventive). Option C is partnering on a lot-controlled atomization run and traceability (highest upfront, lowest lifecycle cost). In my experience at a Midwest aerospace client in 2019, Option C cut rework hours by 42% over 12 months. That tells you where the money goes—inspection time vs. production uptime. Here, particle size distribution and atomization method are not abstract—they influence melt pool stability, which ties straight to porosity and mechanical scatter.

What’s Next?

Technically, the path forward is about data and contracts. We need lot-level certificates that include oxygen content, PSD curves, and a simple flowability number. Integrate incoming QC with build-parameter records (scan speed, hatch spacing) so you can correlate a failed part to a specific powder lot or parameter set. I recommend running designed experiments: change one variable at a time (scan speed, layer thickness), measure tensile strength and porosity, then lock the best profile. Also—yes, this takes time—but the ROI shows up in less scrap and fewer emergency powder buys. I’ve led two such campaigns; one in Q4 2020 yielded a 30% uptime improvement within six months. Short sentence. Longer sentence for the nuance—data matters, and people matter.

Actionable evaluations and closing advice

I speak from direct experience: I’ve negotiated three lot-controlled atomization batches, audited suppliers in Shenzhen and Ohio, and watched teams save real dollars by changing intake rules. If you want crisp guidance, use these three evaluation metrics when choosing powders or partners: 1) Traceable lot documentation (include PSD, oxygen ppm, and flowability score); 2) Build-level correlation capability (can you map a failed part to powder + parameter?); 3) Total cost of ownership (evaluate scrap rate, rework hours, and emergency buy frequency). Measure these quarterly. Also — a quick aside — don’t undervalue a supplier who will run a pilot in your machine; that tells you more than glossy specs. I’ve used that test twice and it prevented two major failures. Final thought: supplier transparency and technical partnership beat lowest-price bids every time. Learn more from partners like Riton when you’re ready to move from firefighting to prevention.

0 comments
0 FacebookTwitterPinterestEmail

The problem and why it matters now

Nothing destroys momentum like a screen that dies mid-presentation. During the 2020 global shift to remote work, enterprises leaned hard on large displays and led screen for conference room setups tied to a video conference system, and single points of failure were exposed in painful, visible ways. Power glitches, connector faults, and controller hiccups turned mission-critical briefings into awkward waits. The stakes are concrete: lost deals, interrupted safety feeds, and damaged reputation. This is a problem-driven case — identify the weak link, then fix it with design choices that refuse to fail.

Where displays fail: common single points of failure

Most outages trace back to a short list: a primary power rail collapsing, a corrupted signal path, or an LED controller giving up under load. Cabling mistakes and centralized power supplies create a single point of failure. Without power supply redundancy or signal loop protection, one faulty module can cascade into a full-screen blackout. Those are design sins, not inevitabilities; they’re preventable with clear engineering choices.

Practical design fixes that hold up under pressure

Start with redundant power. N+1 architectures and dual feeds keep energy flowing even if one module fails. Use hot-swap power modules so technicians can replace units without shutting the display down. Add signal loop protection to prevent a bad link from breaking the entire chain — optical isolation, looped signal topologies, or dual-path Ethernet all work depending on your setup. Pair those hardware steps with robust firmware that supports failover on the LED controller and automatic resynchronization after a fault. These are not theoretical — they’re proven tactics used in control rooms and broadcast environments.

Operational practices: what teams miss

People often assume once the display works, it will keep working. That’s lazy and risky. Routine load testing and staged failover drills surface brittle configurations before they take you down. Cable labeling, segregated power circuits, and periodic firmware checks are basic hygiene. Avoid routing primary and backup feeds through the same physical pathway — redundancy that shares a trench is redundancy in name only. A simple monitoring dashboard that reports input voltages and signal integrity will catch degrading components early.

Common mistakes and quick wins

Teams make three recurring mistakes: relying on a single power source, trusting a singular controller without failover, and neglecting cable-path diversity. Quick wins include installing an uninterruptible power supply (UPS) sized for the display, adding a secondary input path for signal lines, and configuring the LED controller to accept a backup feed automatically. These steps reduce outage probability dramatically — not someday, immediately.

Checklist for procurement and deployment

When specifying systems, insist on measurable redundancy criteria and demand test evidence. Evaluate candidates against these practical points:- Power supply redundancy architecture (N+1, dual-bus).- Signal loop protection strategy (loop topology, optical isolation).- Support for hot-swap power modules and controller failover.Documented MTBF numbers and field case studies are good to see — they prove the design works in real environments.

Advisory: three golden rules to evaluate readiness

1) Uptime target and failover time: choose systems that guarantee an industry-grade uptime and recover within seconds. 2) True physical redundancy: verify separate feeds, separate trays, and independent components so a single cable fault can’t take everything offline. 3) Maintainability and diagnostics: prefer displays with hot-swap modules, on-board diagnostics, and remote monitoring so fixes don’t require hours on a ladder. Follow these metrics and your risk profile drops sharply. When systems are built this way, teams sleep easier and presentations stay live.

For organizations that depend on flawless display performance, the right architecture makes the difference between embarrassment and resilience — and QSTECH offers integrated solutions designed around those principles. A real fix.

0 comments
0 FacebookTwitterPinterestEmail

Start here: why this matters to you

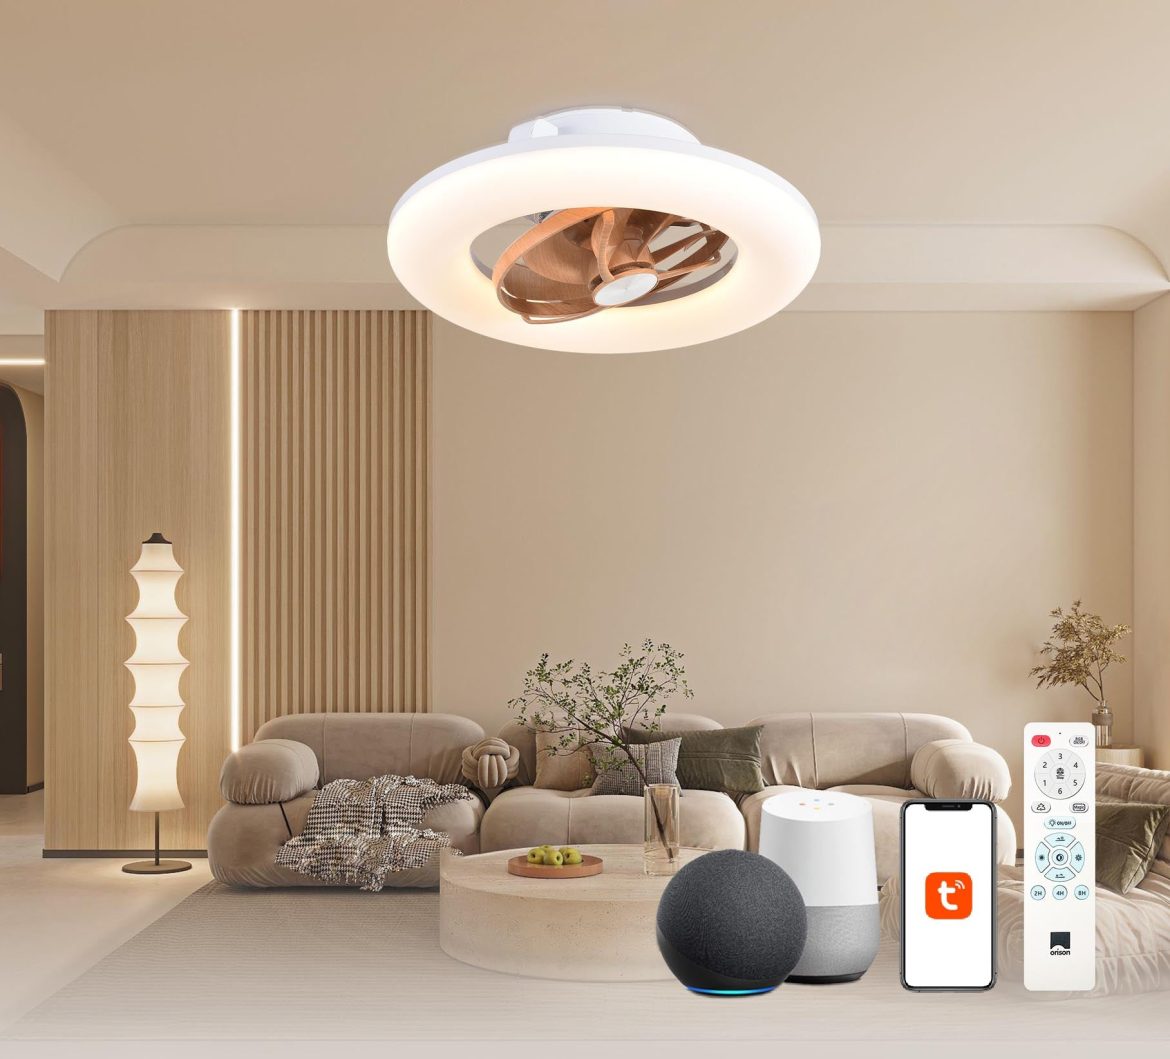
If you want a cooler patio, hands-free lighting, and the convenience of an alexa ceiling fan that actually responds when you say “lights on,” this guide is for you. I’ll walk through the practical steps a homeowner can follow safely, while focusing on real user decisions—from choosing a damp-rated fixture to deciding whether a shorter downrod will reduce wobble. Since voice assistants entered mainstream homes after Amazon Echo’s 2014 launch—when voice became a household interface—integrating voice control has shifted from novelty to expected convenience.

alexa ceiling fan

Who this guide helps (and when to call a pro)

This is written for competent DIYers comfortable with basic electrical tasks: turning off breakers, identifying a neutral wire, and mounting hardware. If your ceiling lacks a standard junction or the ceiling box isn’t rated for fan loads, stop and call a licensed electrician. For most homes with a properly rated ceiling box and accessible wiring, you can handle the install in an afternoon with steady hands.

Tools and parts checklist

Before you start, gather: screwdriver set, circuit tester, adjustable wrench, ladder, wire strippers, and an assistant for lifting. Parts: your damp-rated outdoor ceiling fan with integrated light, mounting bracket, downrod (if needed), canopy screws, wire nuts, and the fan’s receiver or fan controller if it’s a smart model. If you want voice features, confirm the fan works with smart hubs or includes a compatible RF receiver or Wi‑Fi module.

Pre-install checks: safety and compatibility

1) Turn off the breaker and verify power is off with a circuit tester. 2) Confirm the ceiling box is fan-rated — it must support the fan’s weight and motion. 3) Compare the fan’s neck finish and canopy to your box dimensions so the canopy covers the opening. 4) Verify wiring: you should have a hot (or switched hot), a neutral, and a ground. If there are two hot wires, note which one controls the light versus the fan before disconnecting.

Step-by-step installation

– Mount the bracket: attach the fan mounting bracket to the ceiling box per the manufacturer’s instructions, using the supplied screws and ensuring snug fit. – Prepare the motor assembly: secure the downrod if required, pass wires through, and attach the motor to the rod per directions; tighten set screws. – Hang temporarily: use the hook or hangar to hold the motor while you connect wiring—this keeps the motor supported as you wire. – Wire connections: connect fan neutral to house neutral, fan hot to switched hot, and ground to ground. Use wire nuts and tape for security. If your fan has a separate light wire, tie it to the switched hot for wall control or to the fan controller if you want independent app-based control. – Secure canopy and blades: lift and secure the canopy to the bracket and attach blades as directed; tighten all screws. – Power test: restore power and test the fan and light at the wall switch before pairing any smart module.

Adding voice control and smart integration

If your fan supports direct integration, follow the manufacturer app steps to add it to your Wi‑Fi and link to your smart home account. For RF receiver-type smart modules, install the receiver into the canopy between house wiring and fan leads—match colors precisely (hot to hot, neutral to neutral). Once the fan is online, you can link it to smart assistants for a true voice control ceiling fan experience. Remember to enable routines or create separate controls for light and fan speed if the device supports multiple zones.

Common mistakes and quick troubleshooting

People often underestimate vibration sources—uneven blade pitch or loose blade screws cause wobble even when the motor RPM and balance ring are fine. They also mix up the switched hot and constant hot, resulting in a fan that runs even when the light switch is off. Finally, don’t skip the first-article test after wiring; test each function before reassembling the canopy. —If remote pairing fails, try a power cycle and ensure the receiver’s pairing button is pressed within the advertised timeframe.

alexa ceiling fan

Weatherproofing, maintenance, and longevity

Outdoor fans must be wet- or damp-rated depending on exposure. A covered porch usually needs damp-rated fixtures; an exposed pergola requires wet-rated hardware and sealed connectors. Periodic checks—tightening mounting screws, inspecting blade alignment, and cleaning the motor housing—extend life. If you installed a smart module, keep firmware updated and check the fan controller’s heat tolerance in hot climates to prevent premature failure.

Three golden rules for successful installs

1) Verify load-bearing readiness: only install on a fan-rated ceiling box and use the right downrod length to reduce stress and wobble. 2) Prioritize correct wiring and a clear labeling step: mark the switched hot and keep a diagram; it saves troubleshooting time. 3) Match smart hardware to your ecosystem: confirm compatibility with your assistant and choose a receiver or Wi‑Fi module that supports independent light and fan control for flexible voice routines.

These rules keep the focus on safe installation, reliable operation, and seamless voice automation—so your outdoor space works the way you imagine. Orison. —

0 comments
0 FacebookTwitterPinterestEmail

Opening: why a data-first perspective matters

Companies formulating fragrances increasingly rely on quantified stability profiles to predict shelf life, performance, and regulatory compliance for synthetic aroma chemicals. A data-driven appraisal reduces surprises on the production line and in-market complaints: vapor pressure, odor threshold and oxidative stability are measurable properties that correlate with real-world behavior. This article uses objective metrics and industry benchmarks to translate lab results into purchasing and formulation decisions.

Sources and real-world anchor

This assessment synthesizes peer-reviewed studies, supplier technical data sheets, and established industry guidelines such as IFRA recommendations. As a practical anchor, observe how IFRA advisory updates influence reformulation timelines across European perfumers — a change that reverberated through supply chains during the 2020 disruptions. Where possible, we reference common analytical methods like GC‑MS to ensure measurements are comparable across labs.

Core thermodynamic factors that determine stability

Three thermodynamic properties matter most for formulators and procurement teams: volatility (vapor pressure), thermal stability (boiling point/flash point), and propensity to oxidize. Volatility dictates headspace and longevity; a high vapor pressure often means stronger top notes but faster dissipation. Thermal stability informs storage and transport constraints, while oxidative susceptibility predicts off-note development over time. Coupling these with solubility and partition behavior (logP) gives a fuller picture for both oil- and alcohol-based formulations.

How stability is measured — practical assays

Standard practice combines accelerated aging with instrumental analysis. Typical protocols include:- Elevated-temperature storage (e.g., 40°C for defined intervals) to simulate months of ambient aging.- Oxidative challenge tests using controlled peroxides or air exposure.- Analytical readouts like GC‑MS for component integrity and headspace analysis for perceived intensity.These methods produce quantitative endpoints — percent degradation, new peak emergence, and shifts in odor profile — that can be benchmarked across suppliers.

Interpreting data for formulation and sourcing decisions

Raw numbers only gain value when linked to use-case thresholds. For instance, a 10% loss of a highly potent top-note may be acceptable in a cologne but catastrophic for a niche eau de parfum where balance is critical. Likewise, a chemical that shows minor degradation under accelerated oxidative testing might still be usable if paired with antioxidants and appropriate packaging. Consider three practical tiers when interpreting reports: robust (≤5% degradation under standard accelerated tests), moderate (5–20%), and sensitive (>20%).

Choosing suppliers: what to demand from an aroma chemical manufacturer

Procurement should expect detailed technical files, including stability data, GC‑MS traces, and recommended storage conditions. Ask for lot-level certificates and historical acceptance rates for on-time delivery and QC pass rates. A reliable aroma chemical manufacturer will also disclose impurity profiles and provide guidance on compatible antioxidants or pH adjustments. These factors reduce downstream reformulation work and help manage regulatory exposure.

Common mistakes formulators make — and practical fixes

One frequent error is over-relying on single-point data — a supplier’s certificate of analysis from one batch — instead of trend data across multiple lots. Another is assuming compatibility: some molecules show acceptable stability in ethanol but degrade rapidly in triglyceride carriers. The fixes are straightforward: mandate multi-lot stability summaries, run cross-matrix compatibility trials, and include first-article stability checks on finished formulations. —

Summary of actionable insights

Quantitative evaluation of volatility, thermal limits, and oxidative susceptibility gives formulators a defensible basis for ingredient selection. Combine instrumental assays (GC‑MS, headspace analysis) with real-use simulation to translate lab numbers into expected shelf performance. Prioritize suppliers who supply multi-lot data and practical mitigation advice; that combination shortens time-to-market and lowers recall risk.

Advisory: three golden metrics for selection and a closing thought

1) Degradation rate under accelerated oxidative testing — aim for ≤5% for critical top-note components. 2) Lot-to-lot variance in GC‑MS peak area for the principal odorant — seek <10% relative standard deviation. 3) Documented compatibility across intended carriers (ethanol, oils, emulsions) with suggested stabilizers and packaging options. These metrics give procurement and R&D a shared language for risk assessment and cost modeling. In practice, they point directly to suppliers who can support scale and reformulation — and that is where measured expertise pays off in real projects. Linxingpinechem. —

0 comments
0 FacebookTwitterPinterestEmail