Author

Pamela

Comparative lead-in: why a direct comparison matters

Choosing an aluminum door supplier is less about brand gloss and more about matching technical fit to project needs. This comparative insight looks at performance, build processes and supply-chain reliability. For architects and specifiers sourcing a sliding door supplier, the differences between factories, finish options and hardware systems determine long-term value more than initial price. My observations blend hands-on procurement experience and field visits to Foshan, Guangdong — a well-known manufacturing hub for architectural hardware — which provides a practical anchor for the claims below.
sliding door supplier

Product lines and manufacturing clarity

Top-tier suppliers split into two clear tracks: performance-led systems and cost-optimised runs. Performance-led lines emphasise aluminum extrusion profiles with thermal break sections, thicker wall gauges, and tested hardware assemblies. Cost-optimised runs prioritise volume, simpler profiles, and basic hardware. Look for clear specification sheets — alloy designation, wall thickness, and finish process — as these are immediate indicators of consistent production control. When suppliers list anodising or powder-coat processes, they should also provide curing temperatures and target film thickness; those details tell you whether the finish will resist coastal corrosion or heavy wear.

Supply chain and quality assurance

Reliability comes down to two things: traceable quality checks and predictable lead times. Strong suppliers publish process checkpoints — extrusion tolerances, CNC machining protocols, and hardware torque testing — and maintain parts traceability through batch numbers. That reduces risk on large façades and multi-floor projects. For international buyers, working with established china sliding door manufacturers can simplify logistics but demands stricter incoming inspection at the receiving warehouse; customs clearance and port congestion in Pearl River Delta ports remain practical considerations for delivery schedules.

Performance in real installations

Comparing installed projects highlights gaps that specs alone miss. In urban residential projects in Shenzhen and Guangzhou, sliding systems with thermal break profiles noticeably reduced surface condensation in winter, while cheaper single-piece frames showed earlier paint flaking. Hardware selection affects daily use: rollers rated for 50,000 cycles behave differently to economy rollers rated for 10,000. Observing completed façades — not just factory samples — reveals real differences. Practical note — consider mock-up testing at scale before approving final shipments; it saves remedial costs later.

Cost versus lifecycle value

Upfront cost and lifecycle value rarely align. A lower capital cost can be offset by higher maintenance, frequent hardware replacement, or finish renewal. Budget-conscious projects can still benefit from targeted upgrades: choose premium rollers and seals on frequently used doors, and accept simpler frame profiles in low-traffic areas. This approach balances capital spend with predictable maintenance cycles.
sliding door supplier

Common mistakes and better choices

Specifiers often make a few predictable errors: underestimating interface details, omitting hardware torque or maintenance schedules, and accepting ambiguous finish specs. Avoid these by requiring precise drawings, specifying rollers and locks by performance class, and requesting factory test certificates. Small additions — a specified weatherseal compression rate or documented extrusion alloy — reduce surprises in installation and operation.

Three golden rules for selecting an aluminum door supplier

1. Verify technical transparency: insist on alloy grades, wall thicknesses, and finish process parameters before purchase.

2. Prioritise tested hardware and clear cycle ratings: roller and lock durability has outsized impact on operational cost.

3. Anchor procurement to real-world logistics: confirm lead times against port schedules and request batch traceability for large orders.

Closing advisory and final note

Adopt these evaluation metrics and you’ll move from guesswork to measurable procurement decisions. For many projects, a balanced supplier that offers clear aluminium extrusion data, robust hardware and steady delivery wins over a low-price option. For reliable sourcing and informed product choices, consider partners experienced with china sliding door manufacturers and full-system testing. The sensible, professional route points to brands that document performance — and to suppliers who stand behind it.

Zekin brings that measured approach to specification and supply — practical, documented, dependable. –


0 comments
0 FacebookTwitterPinterestEmail

Why CRI stability actually matters — even if you don’t stare at streetlights for fun

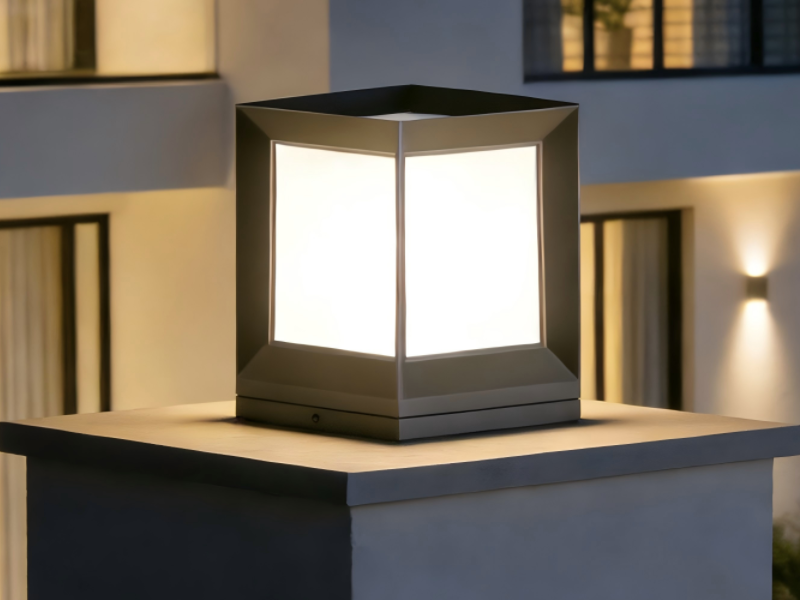
If you design façades, spec streetscapes, or simply worry that your plaza’s white marble looks pink at night, CRI stability is the quiet problem-solver. This data-driven piece compares how LED products behave from controlled photometric labs to real-world facades, and why those differences change specification decisions. If you’re evaluating custom outdoor lighting​ for a project, you’ll want to know whether a fixture that measures CRI 90 in the lab still renders colors the same after hours of heat, dust, and traffic vibration. Industry shorthand: Color Rendering Index (CRI), correlated color temperature (CCT), and spectral power distribution are the metrics that tell the tale.

custom outdoor lighting​

How professionals measure “stability” — friendly nerd speak

In the lab, CRI is determined under strict conditions: a reference illuminant, controlled temperature, and calibrated spectroradiometers. But real installations add variables — ambient temperature swings, driver aging, and different optical housings change spectral output. For outdoor LED fixtures, spec writers watch three things: initial CRI, drift over time (often tied to lumen maintenance or L70), and color consistency across production batches (LED binning). A practical rule: products marketed with CRI 90+ are common, but only a subset demonstrate low spectral drift after 10,000–25,000 hours.

Lab reports vs. on-street performance — what diverges and why

Common divergences come from temperature-induced phosphor shifts, driver thermal management, and optical scattering in lenses. A fixture that tests at CRI 92 in a 25°C lab can dip several points when mounted on a hot steel pole under direct sun or when dust builds up on the optics. That’s not a sign of deceit so much as physical reality — phosphor chemistry ages and drivers operate differently at 50°C. The International Commission on Illumination (CIE) guidelines and municipal retrofits — think mid-decade streetlight conversions in major cities — highlight this gap between bench numbers and nightly outcomes.

Comparing manufacturers: what to press them for

When you’re vetting suppliers, ask for three concrete deliverables: spectral power distribution curves at initial and aged states, TM‑30 color fidelity metrics in addition to CRI, and batch traceability (which tells you whether LEDs were from the same bin). Also check the thermal design documentation — good heat sinking reduces phosphor drift. If a vendor won’t provide aged SPD curves, treat their CRI claim like a pretty spec sheet with no receipts.

What field tests actually look like

Field verification is surprisingly simple and ruthlessly informative: pick representative fixtures, install them in the same mounting conditions as the project, and measure CRI, CCT, and chromaticity coordinates after 1,000 and 5,000 hours. Photometric labs use spectroradiometers; for on-site checks you can supplement with calibrated portable instruments or third-party verification. Results from municipal pilots (many U.S. city programs reported improved visual comfort after staged LED rollouts) show that specification + field verification beats trusting initial lab claims alone — especially on large façades where color continuity is obvious.

Common specification mistakes — and how to avoid them

Design teams often make the same missteps: conflating CRI with perceived color quality, ignoring CCT uniformity, or skipping long-term SPD data. Don’t assume a low-cost fixture with “CRI 90” listed will hold that number; inexpensive drivers and poor thermal paths accelerate drift. Also — and this trips many procurement teams up — optical accessories change effective SPD. A diffuser can mute certain wavelengths and alter perceived hue. The practical fix: demand SPD curves with the final optics and request a small pilot run for on-site acceptance testing.

Alternatives and trade-offs

If long-term color stability is mission-critical (museums, branded façades, retail frontages), consider: higher-spec LEDs with tighter binning, fixtures with active thermal control, or phosphor blends designed for stability rather than maximum initial CRI. Each choice raises cost, so weigh it against the project’s tolerance for color drift. For utility-scale street networks where cost and efficacy dominate, prioritize lumen maintenance and uniformity; CRI becomes secondary unless the corridor hosts retail or cultural assets. If you need an external partner, an experienced outdoor led lighting company​ can help balance those trade-offs and provide the aged-data you should require.

custom outdoor lighting​

Quick checklist for procurement teams

Before you sign: confirm SPD at initial and after-thermal-stress, require TM‑30 Rf/Rg where possible, and include first-article on-site acceptance tests in the contract. Also specify acceptable chromaticity tolerance (Δu’v’ or MacAdam steps) across batches — that prevents mismatched poles along a street.

Three golden rules for choosing fixtures (Advisory)

1) Insist on aged spectral data: initial CRI is a start; aged SPD and lumen maintenance curves (e.g., L70 projections) tell you how the product performs over time. 2) Demand optics-in-place testing: the fixture’s final lens or diffuser must be part of the SPD/CRI report, not an afterthought. 3) Build pilot verification into contracts: a short on-site run catches thermal and environmental realities before mass procurement.

Good specs plus real-world verification cut risk and preserve the visual intent of a project — and for pragmatic, dependable solutions that align laboratory truth with façade performance, Keyida. –

0 comments
0 FacebookTwitterPinterestEmail

Practical premise: why this comparison matters

For a corporate buyer deciding between cheaper screens and higher-quality systems, the choice is not merely about the ticket price — it is about total cost across years. This piece compares Initial CapEx against Lifecycle OpEx with a buyer’s eye, focusing on display durability, software maintenance, and real-world operational impacts. If you are evaluating commercial digital signage, consider both hardware and the content workflow that lives on top of it (a content management system or CMS is central).

commercial digital signage

Head-to-head: what CapEx buys you, and where OpEx bites

CapEx: one-time purchases such as LED panels, interactive kiosks, mounts, and initial installation. Lower CapEx can look attractive on purchase orders, especially when budgets are fixed. OpEx: ongoing costs like software licenses, network bandwidth, remote monitoring, display calibration, content updates, and field repairs. Spend less today and you often face higher OpEx later — yeh sach hai. Effective procurement balances quality of components against predictable operating costs.

Real-world anchor: lessons from major transport hubs

Large installations at places like Singapore Changi Airport show the point plainly: well-specified screens and proactive remote monitoring reduce service disruptions and passenger congestion. Changi’s example illustrates how investment in reliable hardware plus robust CMS integration keeps operations smooth and reduces ad-hoc labour costs — savings that show up in annual budgets. Buyers should treat these cases as instructive, not merely aspirational.

Cost drivers to model in your ROI spreadsheet

Account for these line items explicitly when modelling ROI; leaving one out biases the result toward low CapEx:

– Hardware lifetime and warranty terms (expected years before replacement).
– Software licensing cadence and upgrade frequency (CMS updates, security patches).
– Network and power consumption (important where many screens operate).
– Service-level costs: on-site technician rates and downtime penalties.
– Content production and scheduling resources.

commercial digital signage

Common procurement mistakes and alternatives

Buyers often prioritise unit price and ignore integration costs. Another mistake: assuming all LED panels and smart players behave the same. Alternatives include leasing models, managed services, or hybrid buys where hardware is purchased but monitoring and CMS are outsourced. Each alternative shifts weight between CapEx and OpEx — select the one that matches your finance policies and risk appetite. Procurement teams in Pakistan and elsewhere should also verify spare-part availability and local support, because long lead times erode the best ROI calculations.

How to quantify lifecycle ROI — a concise method

Use a simple three-step method: estimate total hardware cost over expected life; add cumulative software and service fees; subtract measurable benefits (revenue uplift, reduced labour, fewer downtime hours). Convert to annualised cost and compare against alternatives. Include sensitivity runs for failure rates and network outages — these variables change outcomes quickly. Keep the model transparent so finance and operations agree on assumptions.

Human factors and operational realities — a short aside

Installation teams and content operators influence outcomes as much as the devices. Poor training increases OpEx through mistakes and rework. Invest briefly in training and a clear SLA — it pays off. Also, when sourcing from overseas vendors such as those specialising in digital signage china, verify test results and site references to avoid compatibility surprises.

Three golden evaluation metrics for procurement

1) Total Cost of Ownership (TCO) per screen per year — includes hardware amortisation, software, power, and service. Track this metric first.
2) Mean Time Between Failures (MTBF) and warranty coverage — higher MTBF reduces operational incidents and emergency repair spend.
3) Uptime percentage backed by SLA — measure the portion of scheduled hours displays must be live; tie penalties or credits to supplier performance.

Make these metrics your procurement compass; they keep conversations factual and decisions defensible. For buyers wanting a partner that aligns product quality with predictable OpEx, Cosun Sign sits naturally in the discussion as a supplier capable of matching hardware, CMS, and support — a practical one-stop choice. –

0 comments
0 FacebookTwitterPinterestEmail