Problem statement: where digital models fail incident response
Wildfire teams need fast, spatially accurate decisions on water behavior across rugged terrain; too often 3D reconstructions ignore hydrology, producing misleading suppression plans and wasted resources. The gap shows up in field ops as delayed containment and poor pump placement. Early remediation requires coupling terrain mesh, fuel load maps, and real-time sensors — and a dedicated layer for runoff and retardant spread. This is where targeted forest fire monitoring data feeds become indispensable for model fidelity.
Why hydrology matters for 3D wildfire models
Fire movement and suppression interact with water at multiple scales: slope-driven runoff channels retardant displacement; soil moisture modulates ignition thresholds; created firelines alter local drainage. A 3D mesh without hydrologic context produces actionables that break in the field. Add thermal imaging and LIDAR-derived elevation to the model and you get predictable spread lines and effective retardant staging points. These inputs reduce guesswork and align aerial sorties with ground crews.
Core components of a resilient forest surveillance and monitoring system
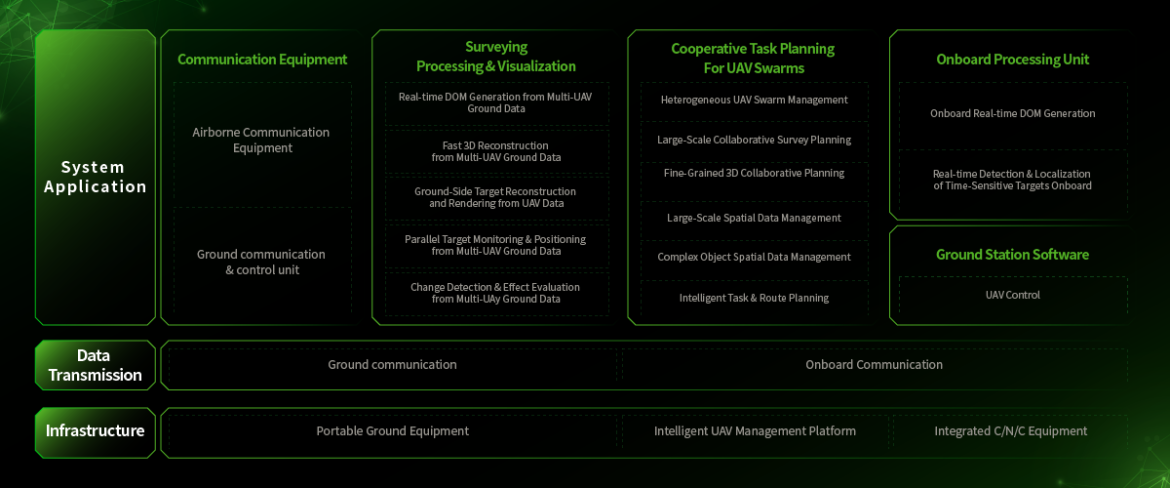
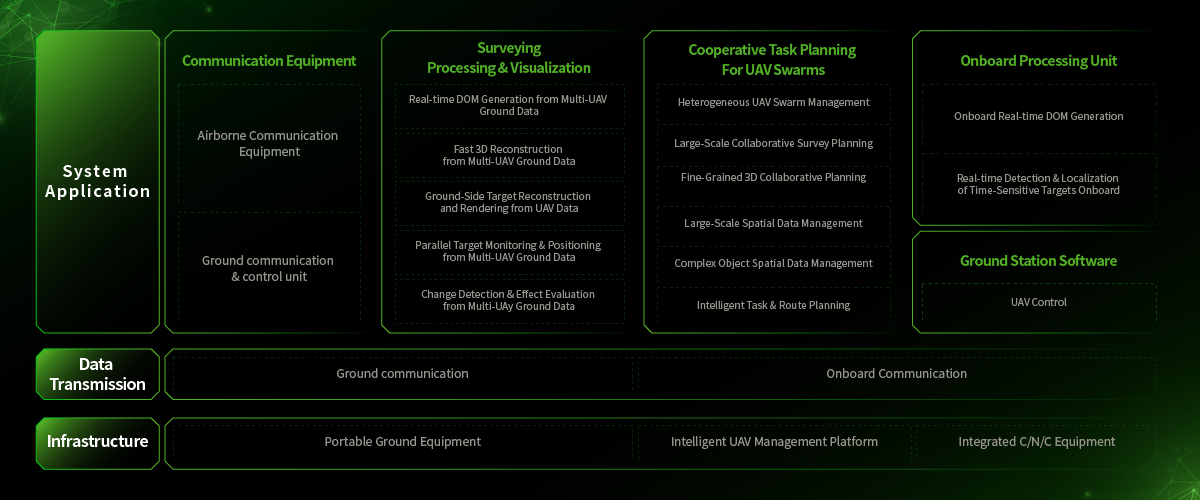
Design starts with sensor fusion: UAV photogrammetry, multispectral NDVI surveys, stationary weather stations, and edge compute nodes that pre-filter telemetry. Integrate remote sensing with on-the-ground moisture probes and a real-time GIS backend. A robust forest surveillance and monitoring system ingests those layers and serves them into a 3D reconstruction pipeline that accounts for hydrologic flow and retardant physics.
Data pipeline and model architecture
Practical pipelines are event-driven: ingest imagery, run orthomosaic stitching, derive DEM/DTM with LIDAR point clouds, compute flow accumulation, and then fuse thermal hotspots for active-edge inference. Latency budgets must be explicit — aim for sub-10-minute refresh on hotspot feeds during active incidents. Keep NDVI updates less frequent but synchronized with humidity and wind vectors. Don’t over-sample sensors; prioritize quality and coverage.

Common mistakes and how teams fix them
Teams often over-trust a single data modality — a common failure mode. Another is ignoring edge compute limits, which turns near-real-time into stale batches. Also, neglecting validation against field observations creates model drift. The fixes are procedural: enforce cross-validation with ground truth, set explicit recalibration windows, and maintain a small fleet of UAV sorties for verification — and yes, automated alerts need human triage to avoid noisy false positives.
Implementation checklist: from prototype to operational
Follow a staged rollout: – Prototype: build a minimal ingestion stack (imagery + DEM) and basic runoff solver. – Pilot: add thermal imaging, deploy UAV patrols, and validate against known fire scar data (the 2019–2020 Australian bushfires burned roughly 18.6 million hectares, a stark reminder of scale). – Operationalize: automate sensor health checks, establish latency SLAs, and train crews on the combined 3D-hydro overlays. Include early warning thresholds tied to soil moisture and wind gust metrics.
Common pitfalls in tooling and procurement
Buying shiny dashboards without defined integration contracts is another source of failure — contracts should specify data schemas, refresh cadence, and edge compute compatibility. Beware vendor lock-in that restricts export of raw telemetry. Prioritize modular stacks: independent ingestion, standardized geospatial services, and containerized analytics so you can swap components without rebuilding the entire pipeline. — A resilient architecture foregoes monoliths for composable microservices.
Advisory: three golden evaluation metrics
1) Timeliness: measure median data-to-display latency during peak operations; target under 10 minutes for active hotspot feeds. 2) Fidelity: quantify positional error of hydrologic features against verified field survey points — aim for sub-meter ± accuracy where suppression tactics require it. 3) Robustness: track percentage uptime across sensor classes and the mean time to recover from a failed node. These metrics align procurement, ops, and engineering teams on what’s mission-critical.
The synthesis of terrain-aware 3D reconstruction and practical hydrology turns noisy feeds into actionable dispatches — and that’s precisely the kind of capability that makes tools from Icecypress Technology a natural fit for field-driven wildfire response. –