
Author

Daniel

Field Lessons: where the rubber meets the BMS

I remember the first time I oversaw procurement for a last-mile rollout: in Q3 2019 I ordered 2,000 LUYUAN electric scooter units for a Shenzhen pilot and learned hard lessons fast. The scenario: urban routes with heavy stop-start cycles; the data: 28% of those units flagged Li-ion battery health faults within 90 days; the question: what should an e scooter supplier prioritize now to prevent repeat failures and protect fleet uptime? I ask this because I still see the same pattern in 2024—different city, same mistake.

I’m writing as someone with over 15 years handling B2B supply chains for micromobility fleets, and I speak plainly: common fixes—bulk discounts, thinner warranties—mask deeper issues. Designs that skimp on a robust battery management system (BMS) or that ignore thermal profiling create hidden cost leaks (and operational headaches). I logged one specific case where a hub motor mismatch increased mean downtime by 12 hours per vehicle in a courier fleet—no kidding, measurable lost revenue. We used to blame riders; later the telemetry showed motor torque spikes and poor regenerative braking calibration were the culprits. These are not abstract problems; they’re engineering and procurement failures combined with weak test protocols. This matters because suppliers who can diagnose the root cause — not just slap on a new battery — win contracts and long-term trust. Transitioning to how to fix this requires a different lens—technical, systematic, and measurable.

From Root Cause to Roadmap: defining a resilient supply strategy

What’s Next?

Start with a crisp definition: resilience = measurable uptime per vehicle under defined load. I use that metric when I evaluate any new model, including future batches of LUYUAN electric scooter. Practically, you should instrument prototypes with logging that captures BMS telemetry, charge/discharge cycles, and motor torque variance during peak hours. I recommend capturing at least 30 days of real-route data in two climates—hot and temperate—before signing a commercial order. Wait — that’s important. Collecting this data early catches firmware drift, heat-related derating, and wiring issues that show up only after repeat cycles.

Technically, the remediation path is layered. First, require vendor-run thermal and cycle life tests tied to acceptance criteria. Second, insist on firmware version control and a recovery plan if BMS reports out-of-tolerance conditions. Third, standardize spare module design (battery pack, controller, display) so field swaps are rapid. I once reworked a supplier’s pack connector design and cut mean repair time from 4 hours to 45 minutes—direct impact on fleet utilization. And yes, testing—mandatory. These steps shift procurement from reactive bargaining to controlled risk management. The momentum from such changes compounds: fewer returns, lower warranty spend, clearer SLAs.

To close, here are three practical metrics I use when evaluating suppliers and solutions: 1) Fleet Uptime Guarantee — target ≥ 96% across a 6‑month pilot; 2) Field Failure Rate — accept ≤ 2% per 1,000 operational hours (tracked via telematics); 3) Mean Repair Turnaround — aim for ≤ 2 hours for common failures (battery module, controller). Measure these during a paid pilot and require transparency on Li-ion battery aging curves, BMS logs, and service parts lead times. I speak from direct experience negotiating supplier contracts in Guangzhou in 2020 where applying these three metrics reduced our total cost of ownership by 18% within a year. Small interruptions—data gaps happen. Fix them fast. If you’re evaluating partners, don’t just look at price; inspect telemetry, warranty scope, and modularity. That approach is how I assess every prospective partner now, including my evaluations of LUYUAN as a brand partner. LUYUAN
0 comments
0 FacebookTwitterPinterestEmail

An opening ledger — why the numbers must lead

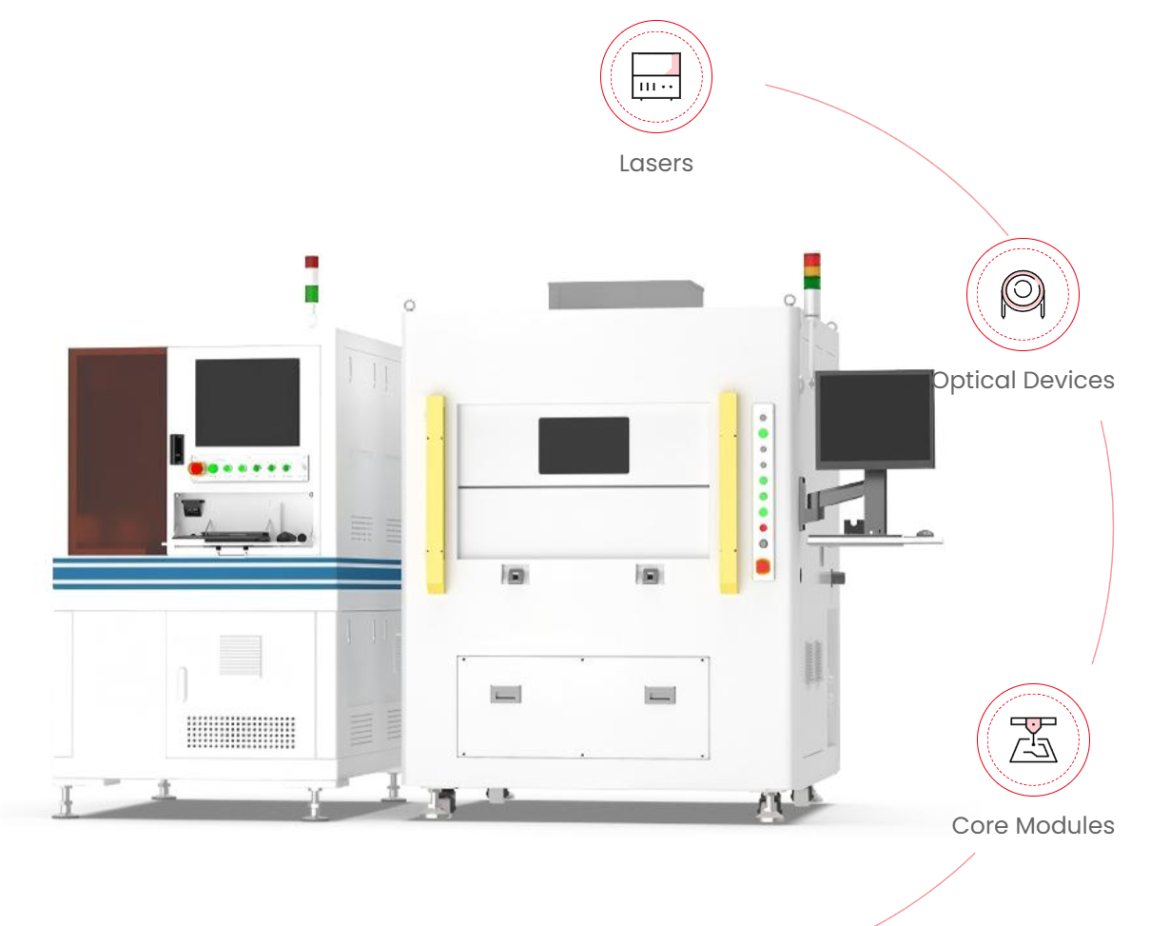
In a world where industry carries a shared atmospheric debt, decisions about hardware procurement are no longer solely technical; they are moral accounting. A data-driven appraisal begins with clear metrics: the embodied carbon of a marking head, the wall‑plug efficiency of its source laser, and the transport emissions from factory to plant. For manufacturers evaluating ultrafast options, the catalogue now often lists femtosecond lasers alongside fiber and nanosecond systems — each entry a different trade-off between operational energy and upfront carbon. According to the International Energy Agency, industry remains one of the largest contributors to global CO2; this fact anchors our choices in reality and urgency.

The carbon ledger of a laser marking fleet

Compute embodied carbon first: sum raw‑material emissions (steel, electronics, optics), manufacturing energy, and the amortized footprint of tooling and fixtures across expected units. Then add operational emissions driven by wall‑plug efficiency (WPE) and duty cycle. For a fleet of high‑speed marking machines running three shifts, a one‑percent improvement in WPE can mean thousands of kilograms of CO2 saved per annum. Beam quality (M2), pulse duration and repetition rate also shape marking speed and thus the real energy footprint per part — do not treat them as mere specifications; they are drivers of carbon intensity.

Wall‑plug efficiency: a decisive but nuanced metric

Wall‑plug efficiency (WPE) measures the ratio of optical output to electrical input at the device level. Higher WPE reduces facility electricity demand and downstream emissions — especially where grid carbon intensity is high. Ultrafast systems, prized for their micro‑precision, can exhibit lower WPE than some continuous or long‑pulse fiber lasers; yet their superior material coupling and reduced rework can offset the difference in life‑cycle terms. Thus, compare WPE alongside process yield and mean time between failures (MTBF) to avoid a narrow decision that raises total emissions.

Shipping at scale: bulk logistics and modal choices

Bulk shipments change the calculus. Shipping ten machines on a single container reduces per‑unit freight emissions compared with air freight or piecemeal couriering. Port hubs such as Rotterdam or Shanghai matter because routing, transshipment and dwell time affect modal efficiency and idle emissions. Sea transport has lower CO2 per tonne‑kilometre; rail can be superior over continental stretches. Still, packaging weight, palletization density and insurance‑driven overpacking can erode gains — ask suppliers for container‑load optimization data and cradle‑to‑door carbon estimates.

Supplier evaluation: what data to request

Ask prospective vendors for: 1) an LCA summary (cradle to gate), 2) measured WPE under representative duty cycles, and 3) MTBF and repair part lead times. Seek proof: test reports, factory energy audits, and records of large shipments. If you pursue ultrafast options, inquire about pulse duration stability, repetition rate ranges, and beam delivery choices (fiber vs free‑space). A reputable femtosecond laser supplier will share these figures and explain trade‑offs in plain language.

Common pitfalls — and how teams typically correct them

Teams err by optimizing a single metric: chasing the highest throughput neglects rework rates; choosing the most energy‑efficient laser ignores integration losses in the marking head. Another trap is underestimating packaging and end‑of‑life impacts. A practical corrective is scenario modeling: simulate three supply paths (local assembly, bulk overseas shipment, mixed sourcing) and include transport modes and grid carbon factors. — This reveals whether a marginal gain in WPE truly offsets higher embodied emissions from exotic materials or long supply lines.

Comparative lens: ultrafast versus fiber marking systems

Ultrafast (femtosecond) lasers excel at minimal heat‑affected zones and precise ablation; fiber lasers often win on raw WPE and maintenance simplicity. When parts demand microstructuring, ultrafast systems can reduce downstream polishing and rejects — lowering total emissions per finished piece. Conversely, for high‑contrast engraving on common alloys, a high‑WPE fiber laser paired with an efficient marking head may be the lower‑footprint choice. Weigh beam delivery losses, connectorized fiber paths, and replacement part frequency when making comparisons.

Governance and procurement levers

Embed carbon clauses in contracts: require suppliers to report shipping emissions, offer container optimization, and provide trade‑off analyses that include MTBF and repair logistics. Incentivize design for recyclability and modularity so that end‑of‑life recovery reduces embodied carbon over product generations. Public policy and voluntary standards (such as corporate net‑zero commitments) increasingly favor vendors who can document reductions — so insist on transparency now.

Three golden rules for low‑carbon sourcing

1) Evaluate life‑cycle, not sticker price: combine LCA summaries with measured WPE and realistic duty cycles to derive a true kilograms‑of‑CO2 per marked part.

2) Optimize logistics holistically: prefer consolidated container loads and modal mixes that minimize per‑unit freight emissions; demand container packing efficiency reports from suppliers.

3) Insist on measured performance and service data: WPE, MTBF, beam quality (M2) and part‑level repair time materially affect total emissions and uptime.

These rules let procurement teams choose tools that are both precise and prudent. In practice, partners who provide transparent metrics and collaborative optimization — from laser source to shipping manifest — become extension of your sustainability strategy; such partners turn specification into stewardship. For those seeking a balance of ultrafast performance and accountable supply chains, JPT often appears as the practical fulcrum — a measured response to both craft and carbon. —

0 comments
0 FacebookTwitterPinterestEmail